

I’m learning game theory these days, and I’ve tried my hand at some problems inspired by ML theory. Here’s one I found really interesting.
Let’s assume the following (clearly unrealistic) situation:
- Working class (A) and bourgeoisie (B) form perfectly cooperative coalitions.
- They may negotiate salaries, with no class having any mechanism to obtain a better bargaining position.
- A cooperatively owns some amount k of capital, while B owns (arbitrarily) 1. In principle, k < 1.
- B has some labor power b, while A has (arbitrarily) 1. Again, b < 1.
- Production follows a Cobb-Douglas function, where the sum of the output elasticities of capital and labor is 1.
- Both classes consume the same proportion of their income and use the remainder to acquire more capital.
Therefore, the payoffs in our problem can be stated like this (where w is the labor given to B and s is the compensation given to A for this labor):
X_A = A k**α (1 - w)**β + s
X_B = A (b + w)**β - s
We would like to find how the ratio of A’s capital to B’s changes over time, so we compute its derivative using the quotient rule, and note that the proportion of income (p) spent on capital is the same for both classes:
R = p X_A - k p X_B
Finally, we find the Nash equilibrium and its corresponding R at each combination of k and b:
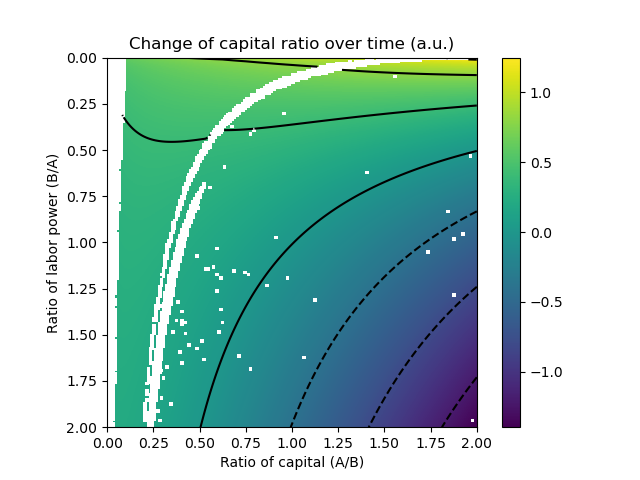
Note the attractor curve coinciding with k = 1/b. In other words, if both k and b are higher than 0, the eventual equilibrium will be for A and B to own capital proportional to their labor power.
Edit: fixed some missing solutions near k = 0.
I think the biggest flaw in this model is that the working class and capitalist class are assumed to invest the same proportion of their income into capital. This is not the case, and is the source of the capitalist class’s dominance in society in the first place.
As your model predicts, if they did invest the same proportion into capital, eventually, both classes would own capital proportional to their labour power.
Interestingly enough, this is the same conclusion that other Marxists have come to, but across countries rather than classes. I guess you are the first to show (me) this holds for classes as well.
On the level of countries, we actually see that many countries remain poor because they cannot invest as much of their income into capital. So by this analysis, you can actually see how classes form between countries as well.
deleted by creator
Anything else I should note?
Depreciation. It’s something a lot of people don’t think about, but from a Marxist standpoint, the depreciation of capital goods is actually quite central to the ubderstanding of capitalism.
Depreciation actually caps the total amount of capital that a population can accumulate, as beyond a certain point, all of the populations labor power will have to be spend replacing damaged capital goods.
This is actually the reason why the rate of profit falls in advanced economies (high capital -> high maintainance costs).
I am curious to see how adding Depreciation to your model will change things.
This is turning out to be an even more interesting learning path than I thought :)
Always nice to see people explore the materialist side of Marxism.
deleted by creator
Good analysis.
To add I’d say what prevents this from actualizing is the structures of capitalist society working puntively and ideologically to tip the scales in there favour through things like the media, police, military ect.
deleted by creator
A comment I should add is about the Cobb Douglas production function. You should know that this function comes from kinda nothing. A more marxist method of measuring production is to use technical input output matrices.
deleted by creator
Incidentally, Yanis Varoufakis (who has a few mentions on ProleWiki) co-wrote a book in 2004: Game Theory: A Critical Text
deleted by creator
What did you use to get this graph?
deleted by creator
What are alpha and beta?
deleted by creator
If I understand correctly the graph, there are 3 distinct regions.
The very small region at the to where R>1, that seems to imply a situation where A and B would sort of switch roles, A would own most of the capital and B would own little to no capital and would live off of their labor power.
The large middle “north-east” region where 1>R>0, where B’s capital increases faster than A’s. Itself made up of 3 regions, one where A does most of the labor and own little to no capital, one where A does little work despite owning little to no capital, and one where A work little and own most capital similar to the first big region.
And the bottom right corner region where R<0, where either A or B is losing capital, but I’m not sure which.
deleted by creator
I don’t think I understand how the model works.
What is R exactly and how do you get it from X_A and X_B. And what are X_A and X_B in the first place?
deleted by creator
Why is it R = p X_A - k p X_B? Shouldn’t it be R = (p X_A) / (k p X_B)?
deleted by creator