Retired gamer
- 43 Posts
- 27 Comments

 4·7 months ago
Sorry, don’t have a source on that. Scrolled a million bananas on reddit this year and everything is a blur. :)
I’m assuming DTCC just watches Computershare’s broker for Computershare’s transactions. Doubt they would ever contact Computershare and leave a trail.
Check out TheUltimator5’s posts on recurring buy fills: https://www.reddit.com/user/theultimator5/
I think 6days1week had the Computershare recurring buy dates marked on a calendar, or maybe TheUltimator5 mentions in one of his posts.
I used the most basic average $1.2 million buy every 2 weeks and used only $14 a share as an example. So 85,714 shares * 6 times a quarter = 514,284 shares from just recurring buys each quarter. Mileage will vary of course on GME share price at the time.
I think the DTCC side can see all broker transactions.
- Computershare’s bi-weekly recurring and daily purchases go through a broker.
- Broker DRS transfers to Computershare notify the DTCC that a stock withdrawal is taking place.
- I think I saw a redditor mention a rule/agreement that the DTCC can ask to see a transfer agent’s books at any time, too.
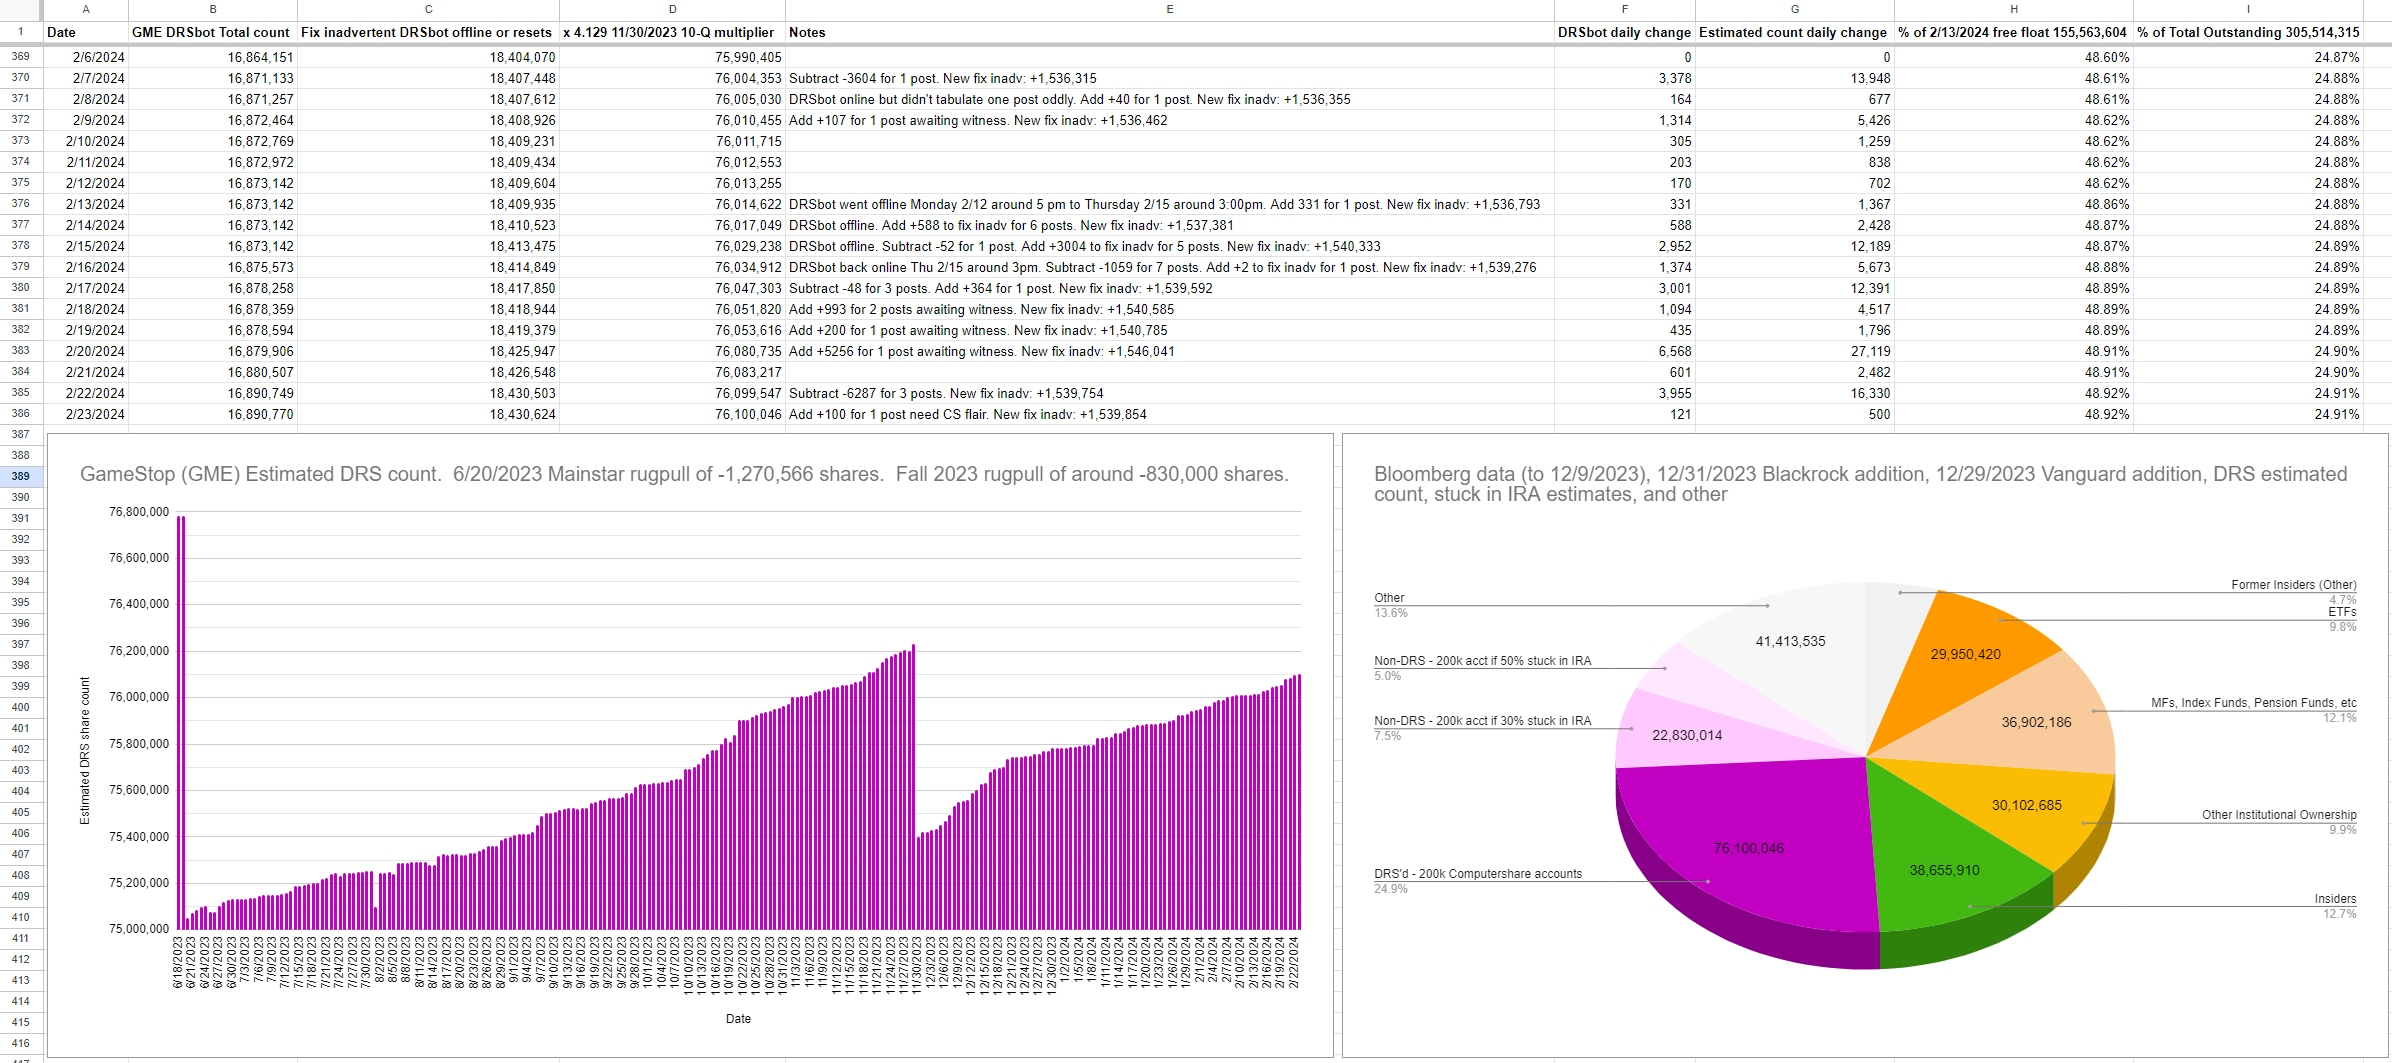
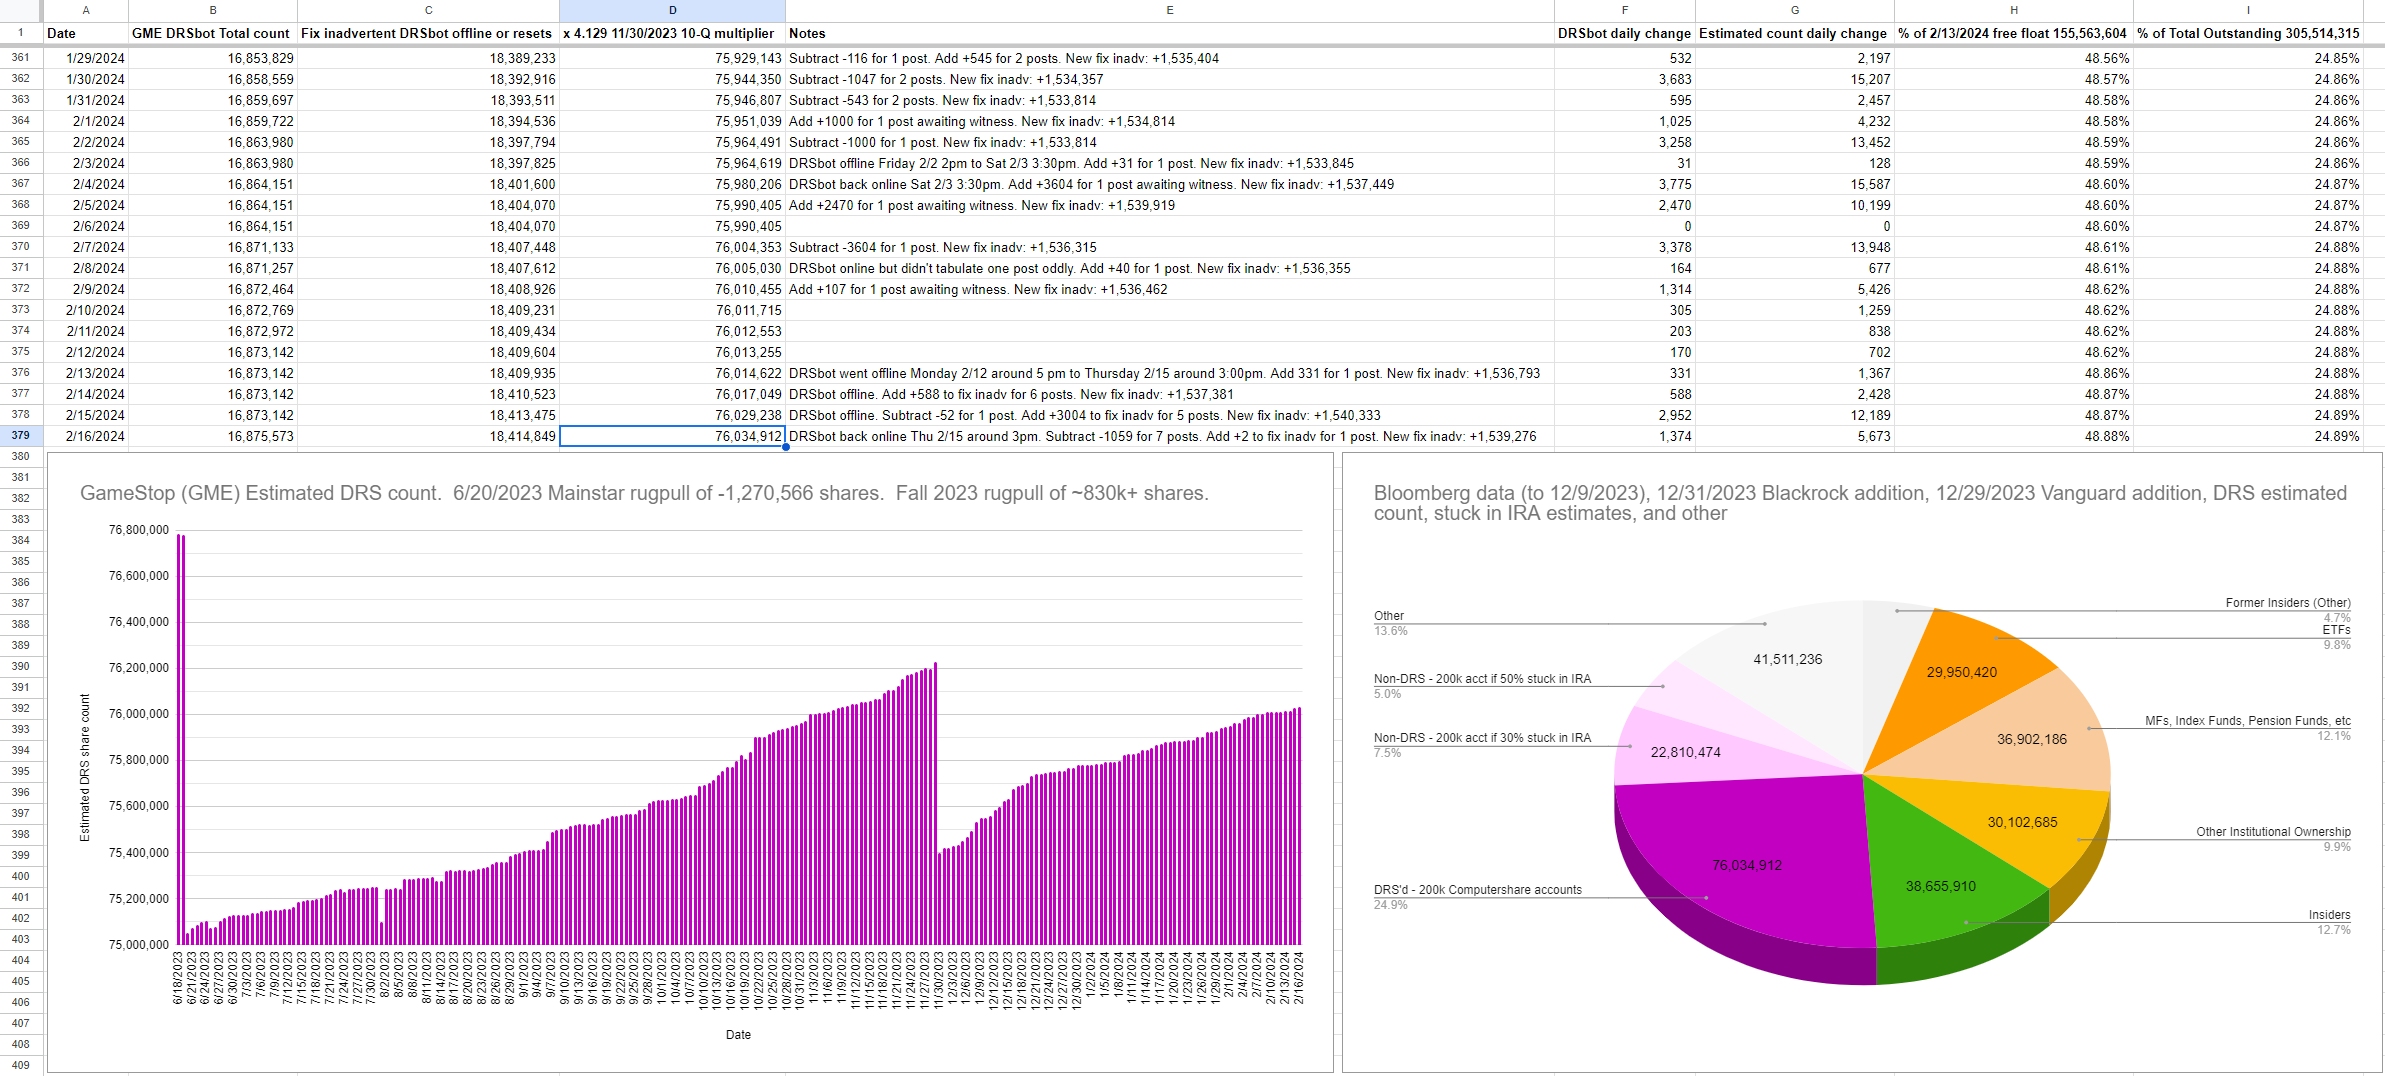
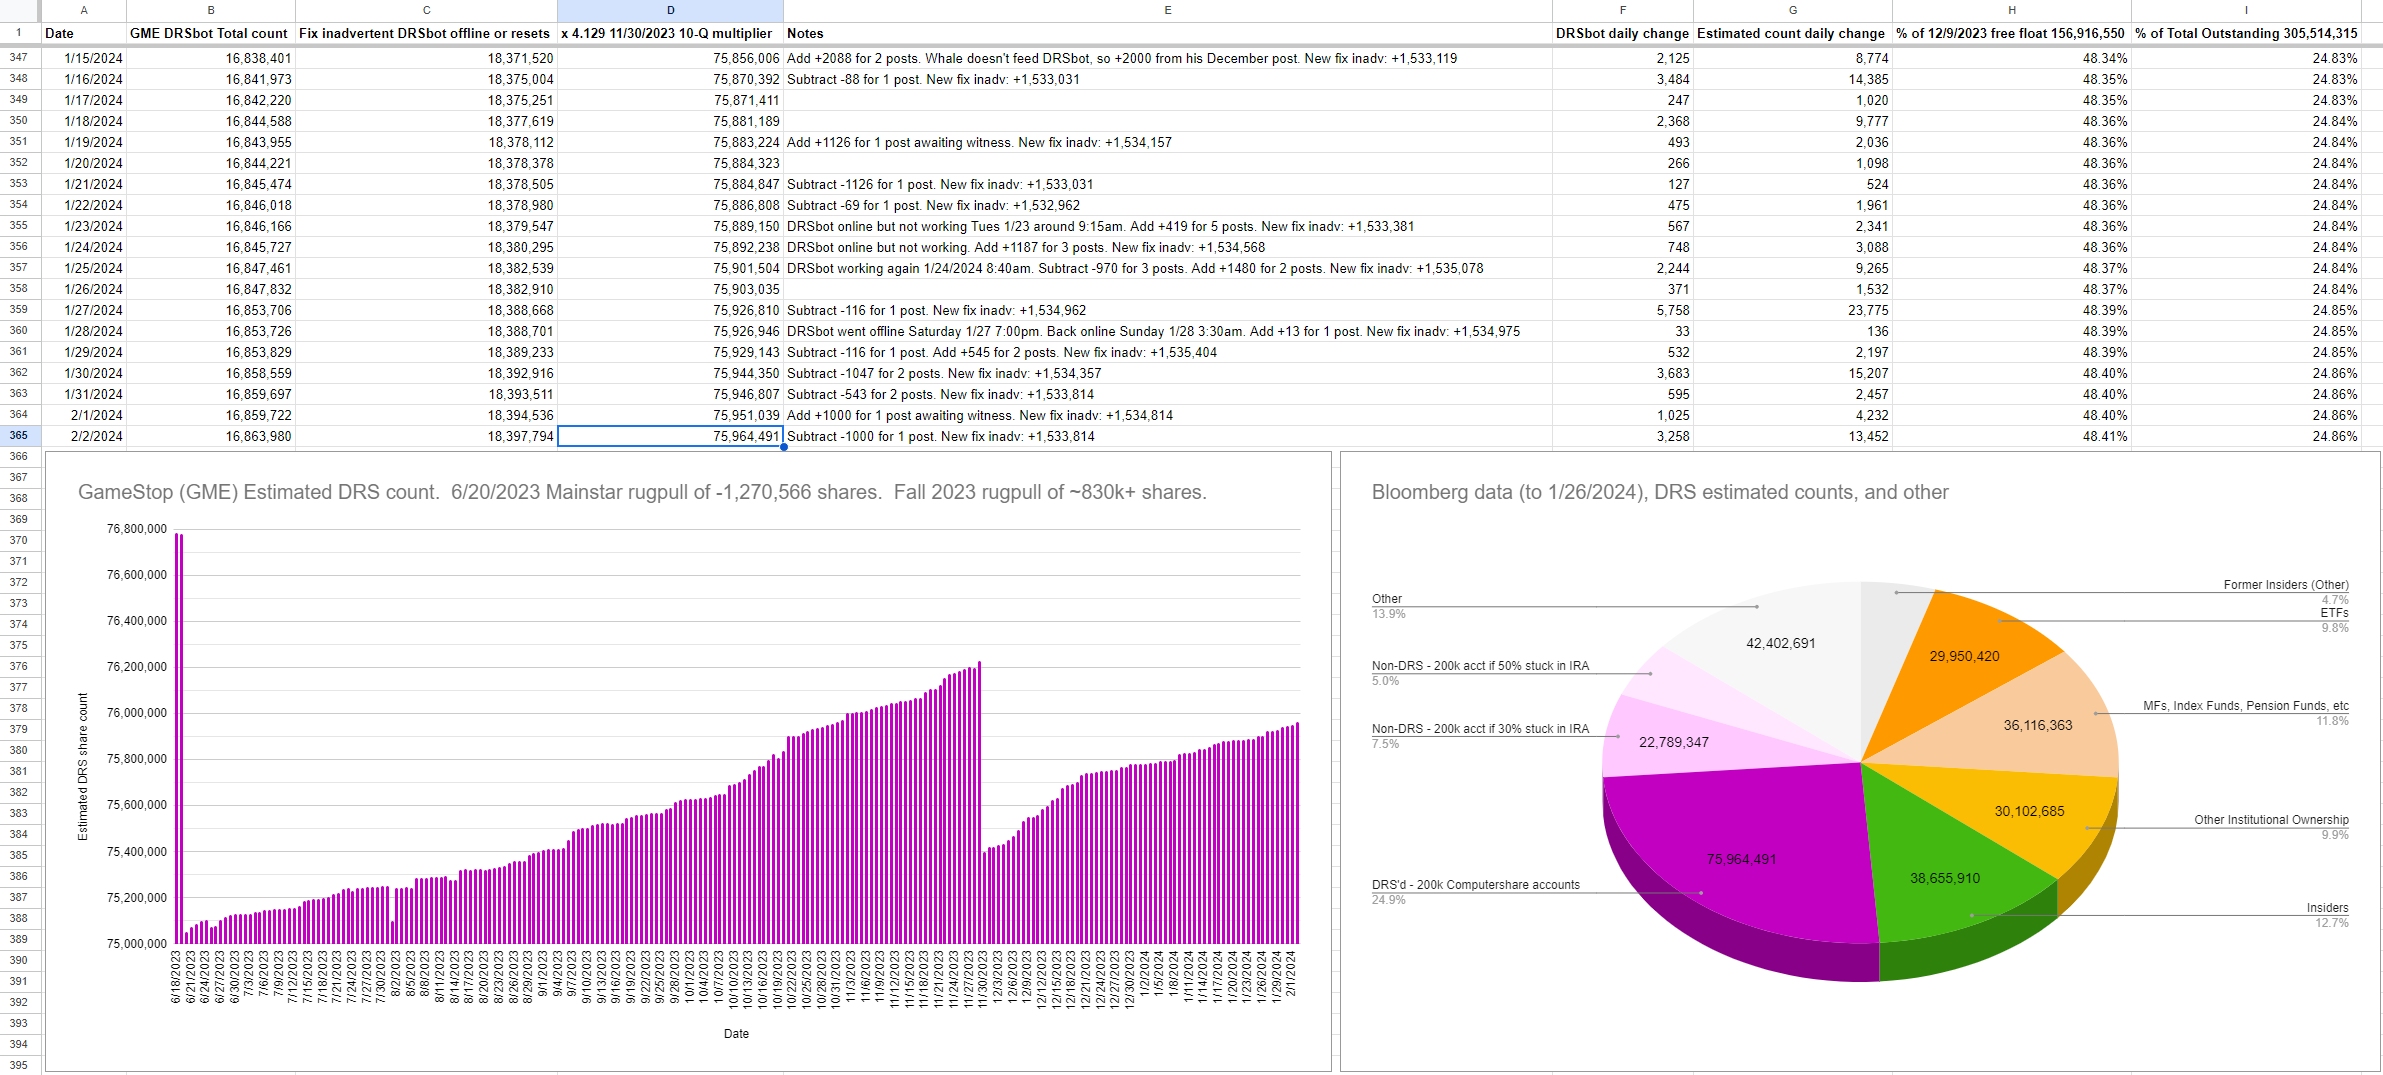
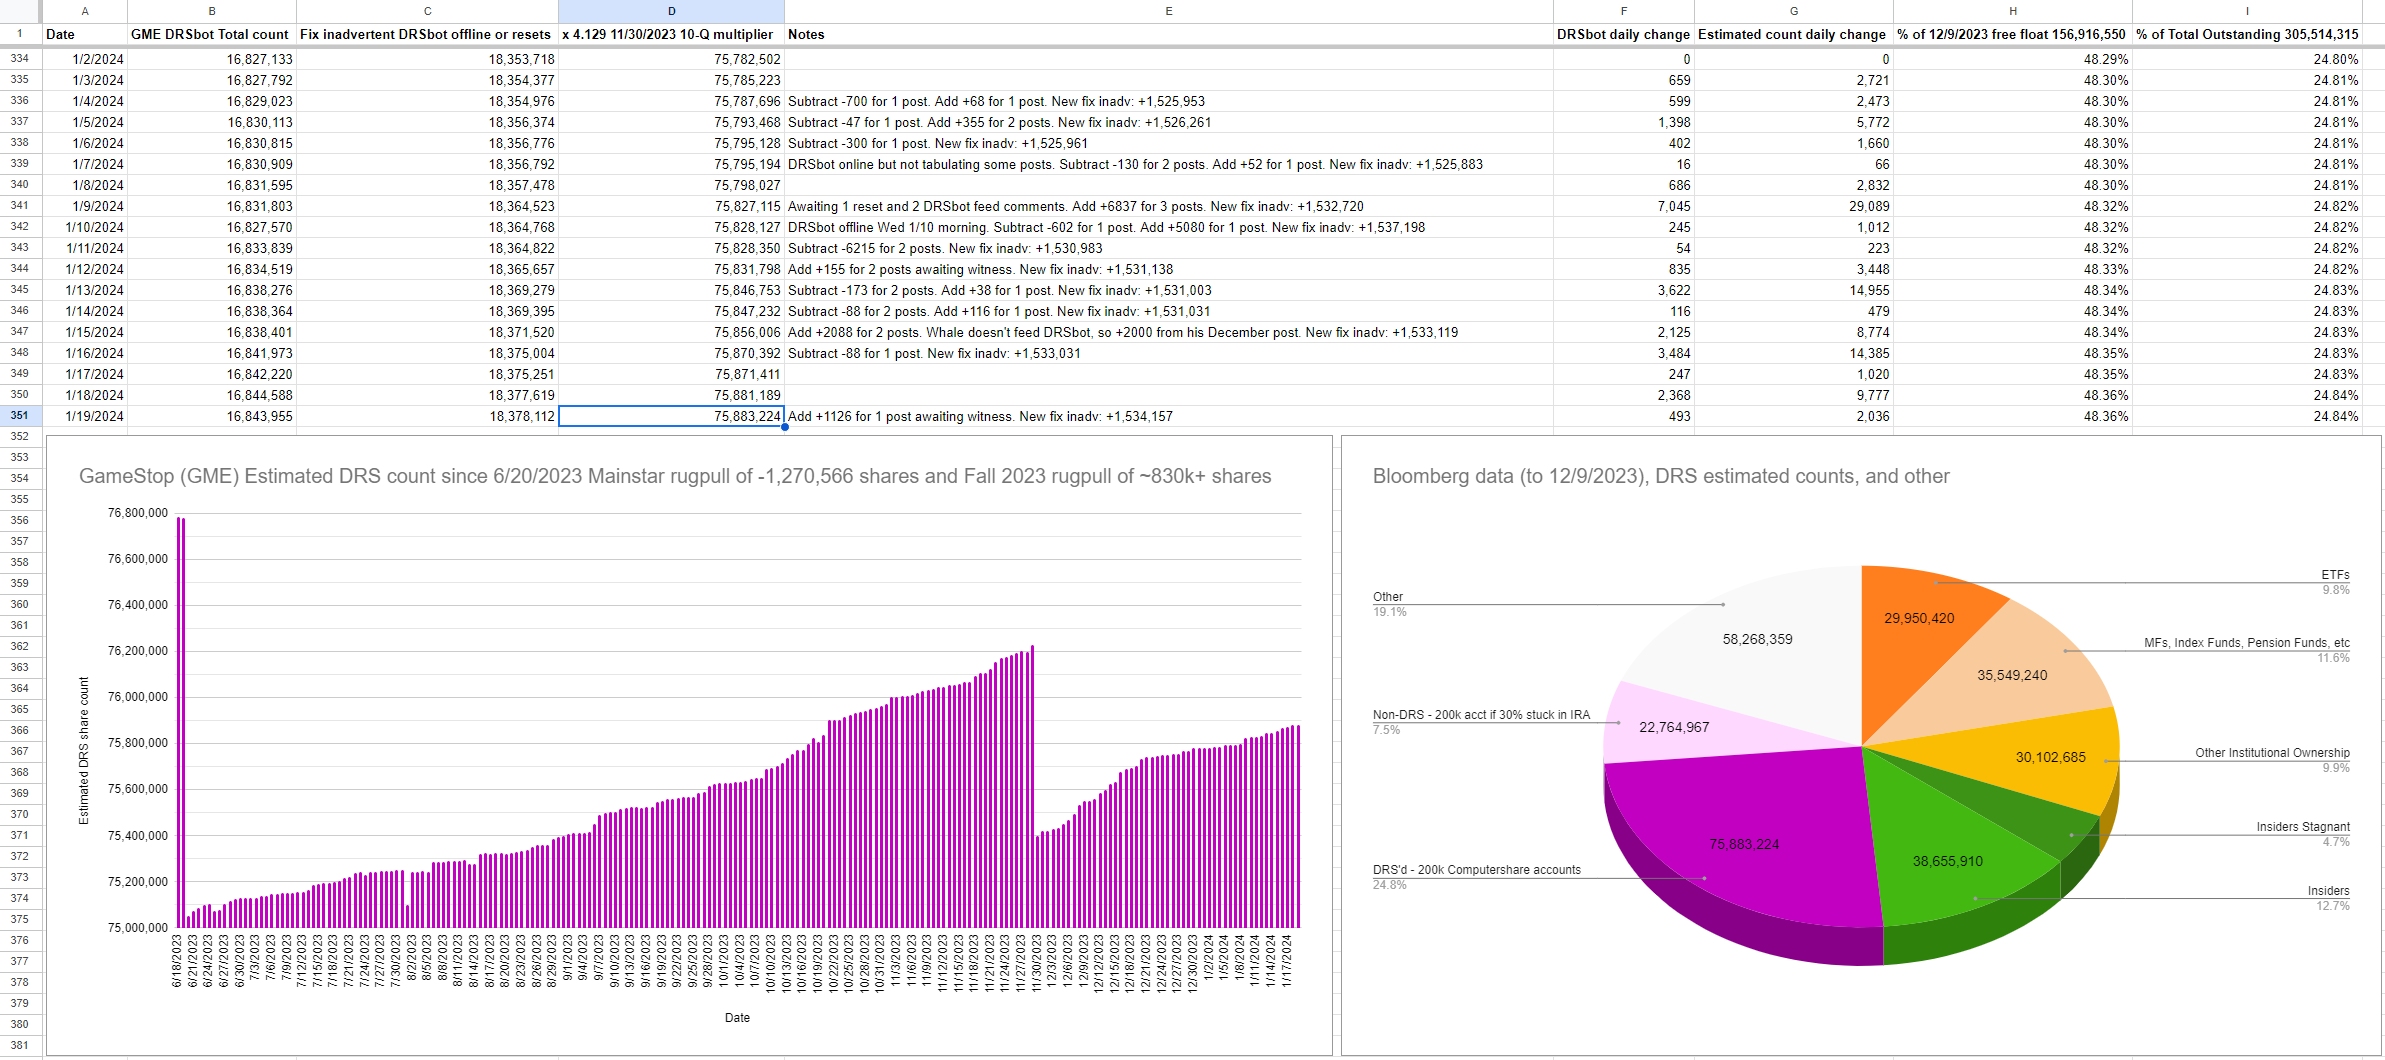
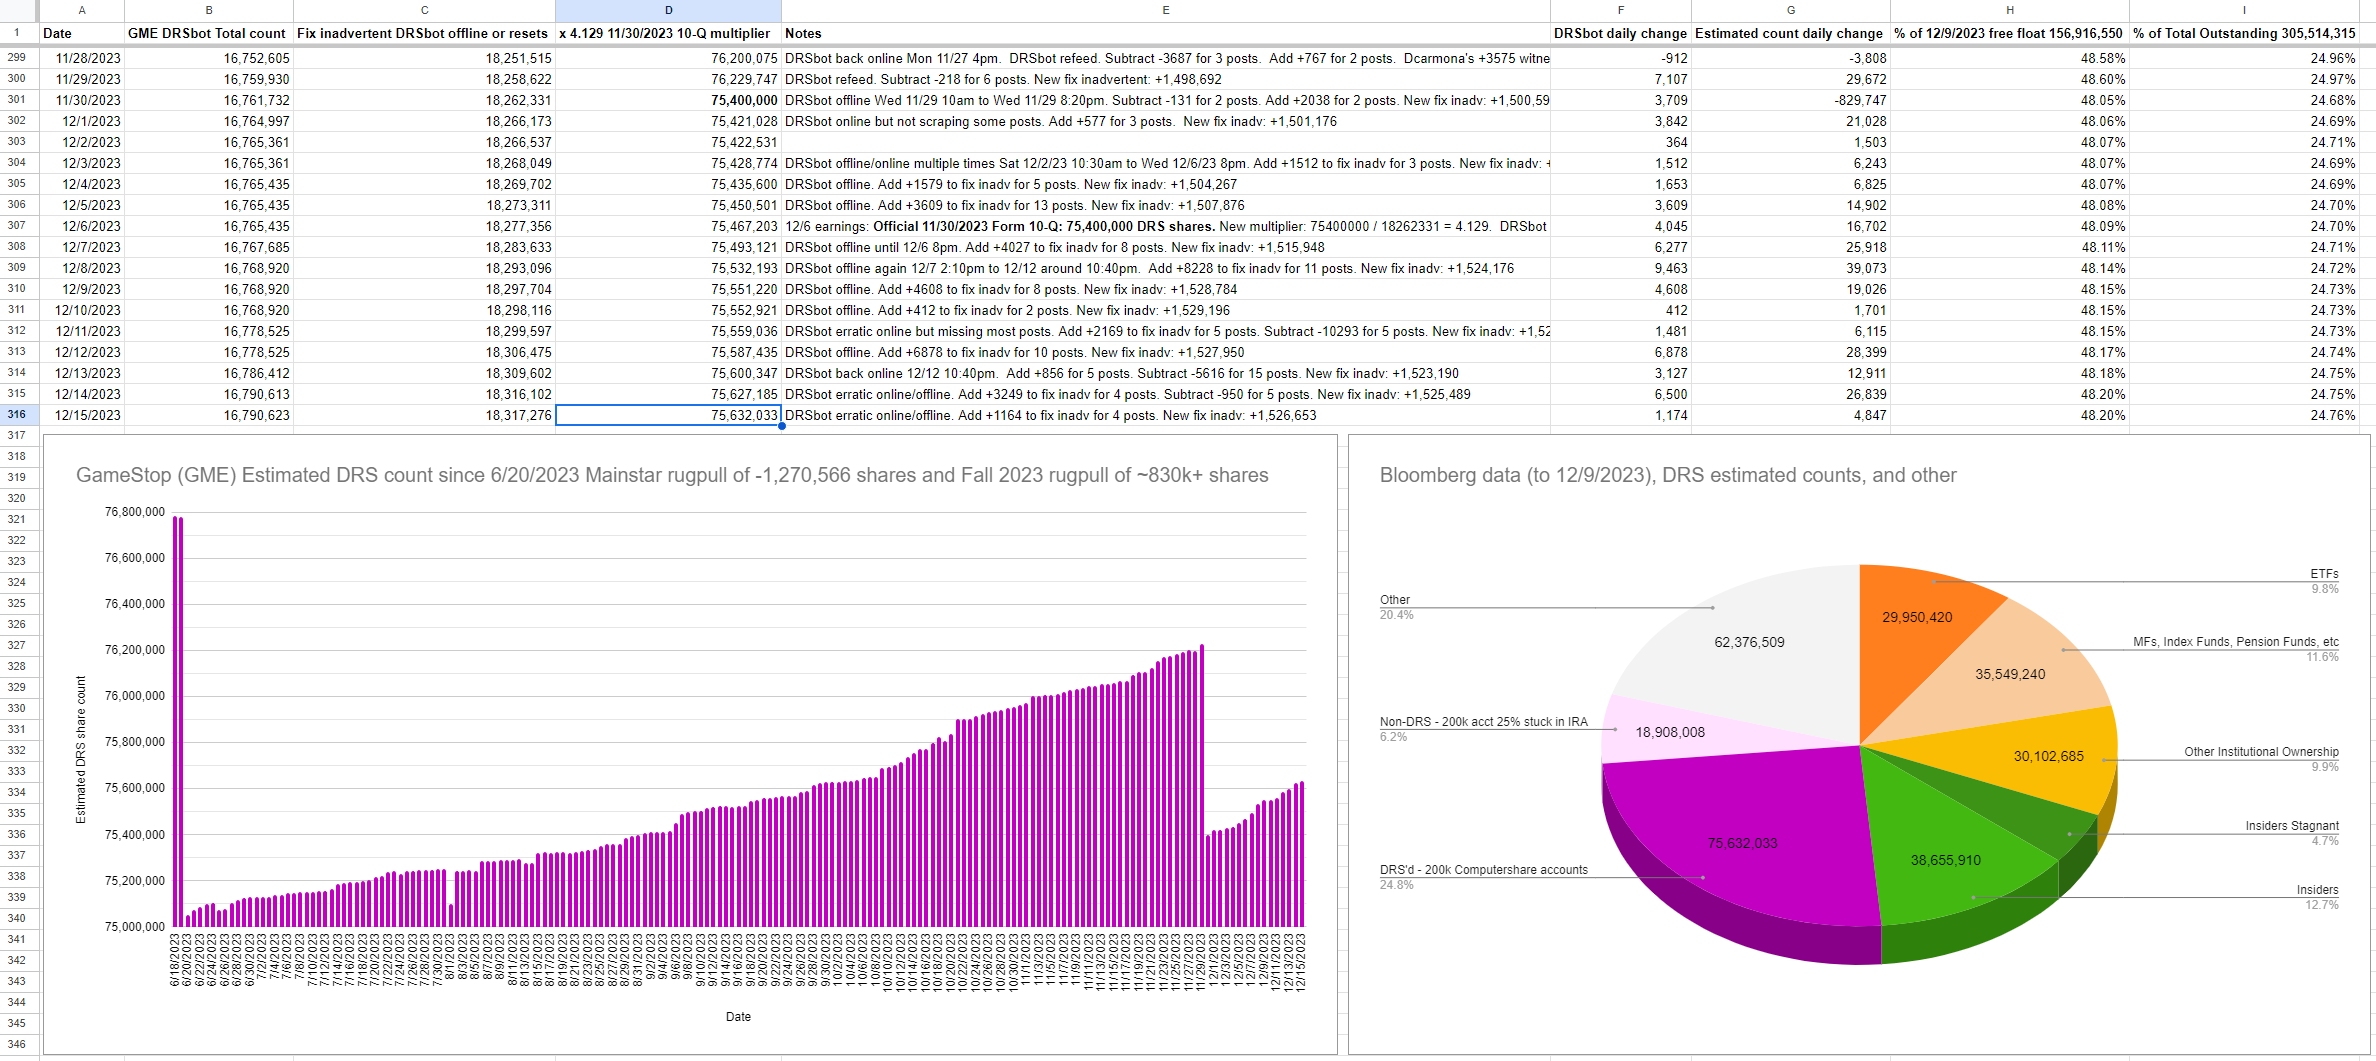
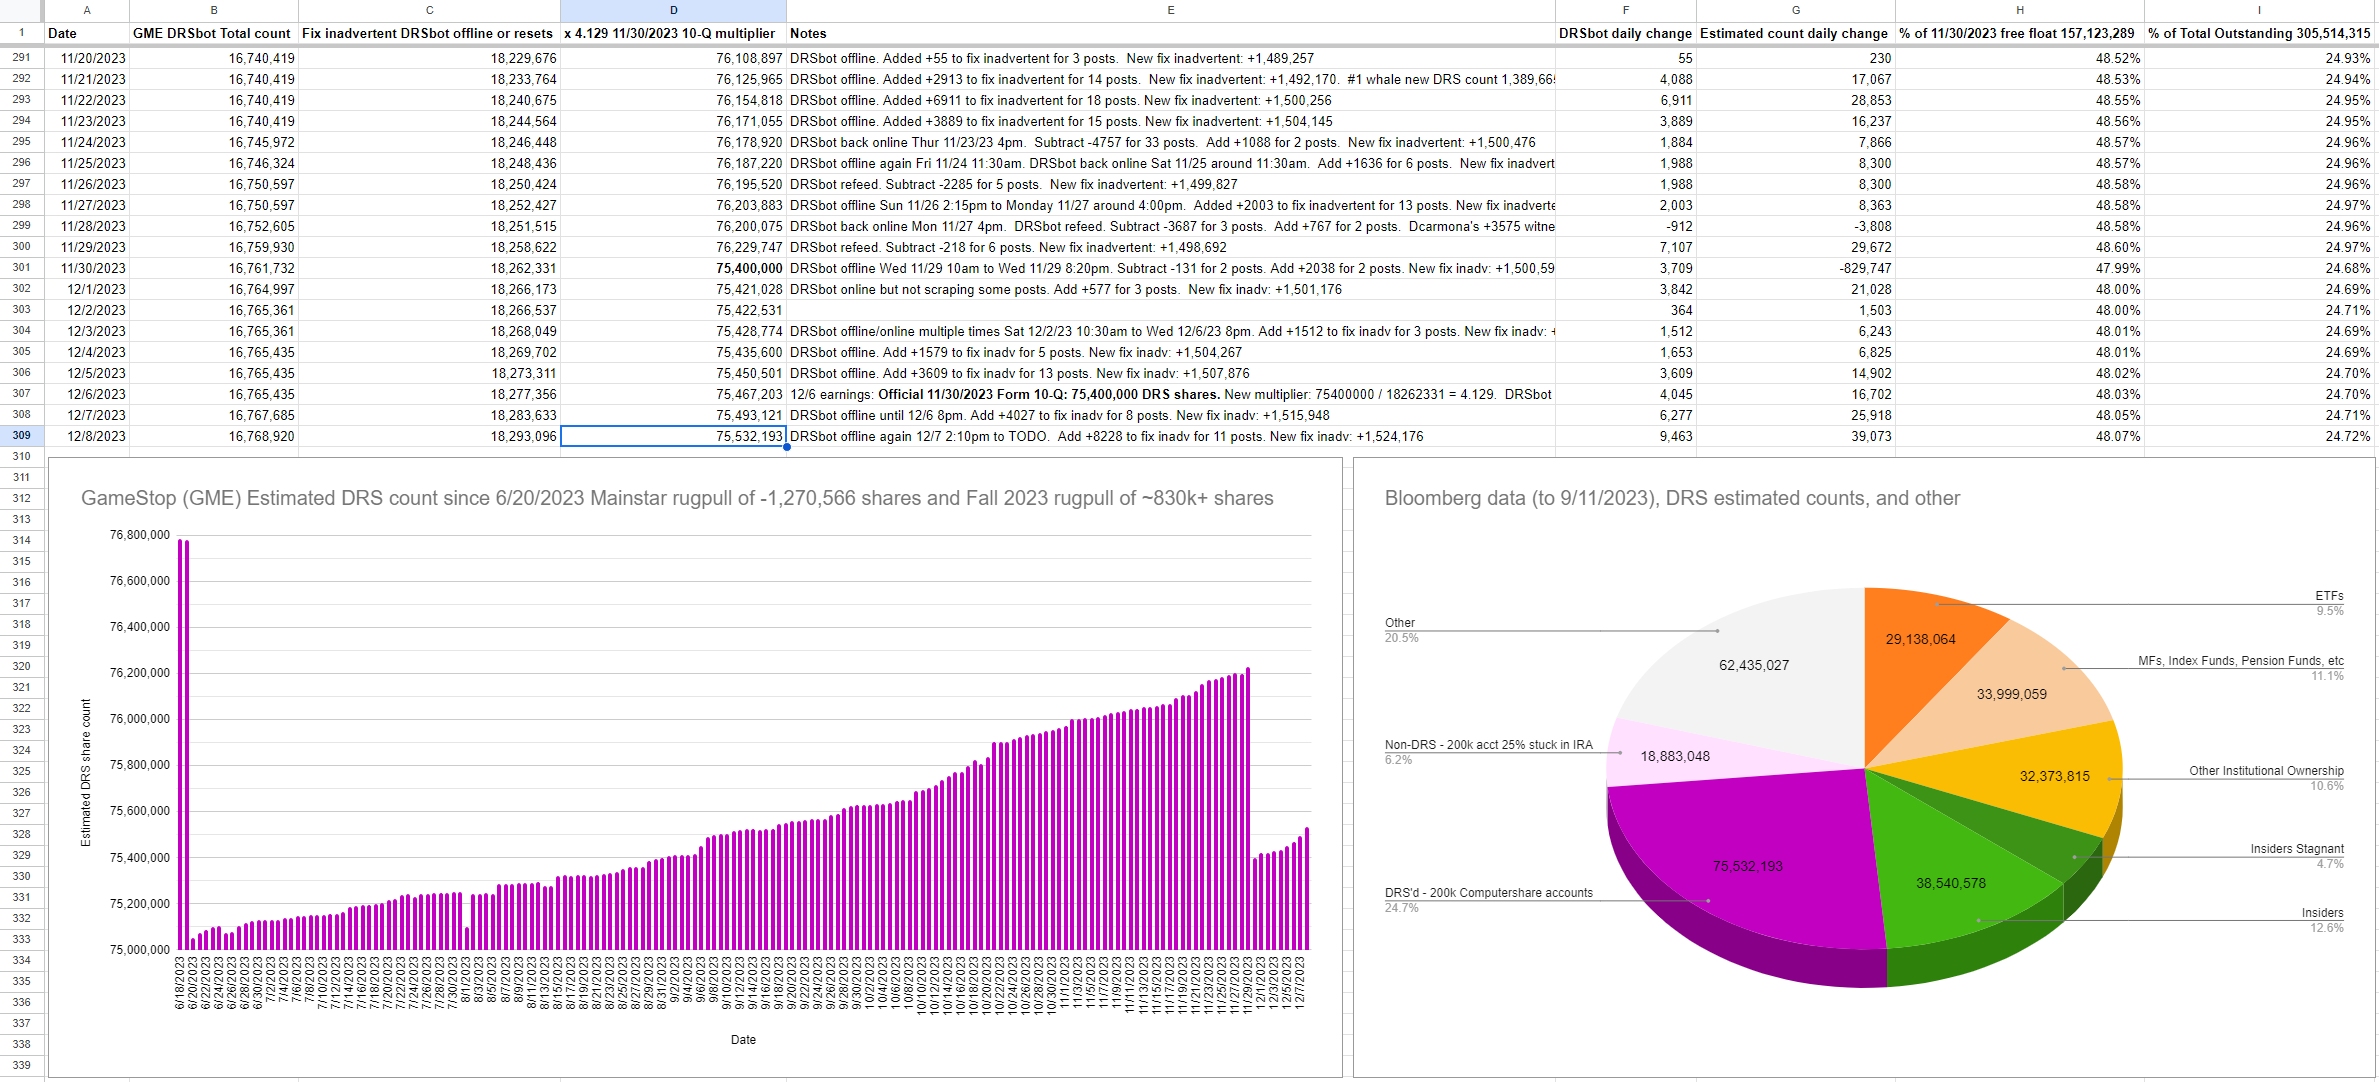
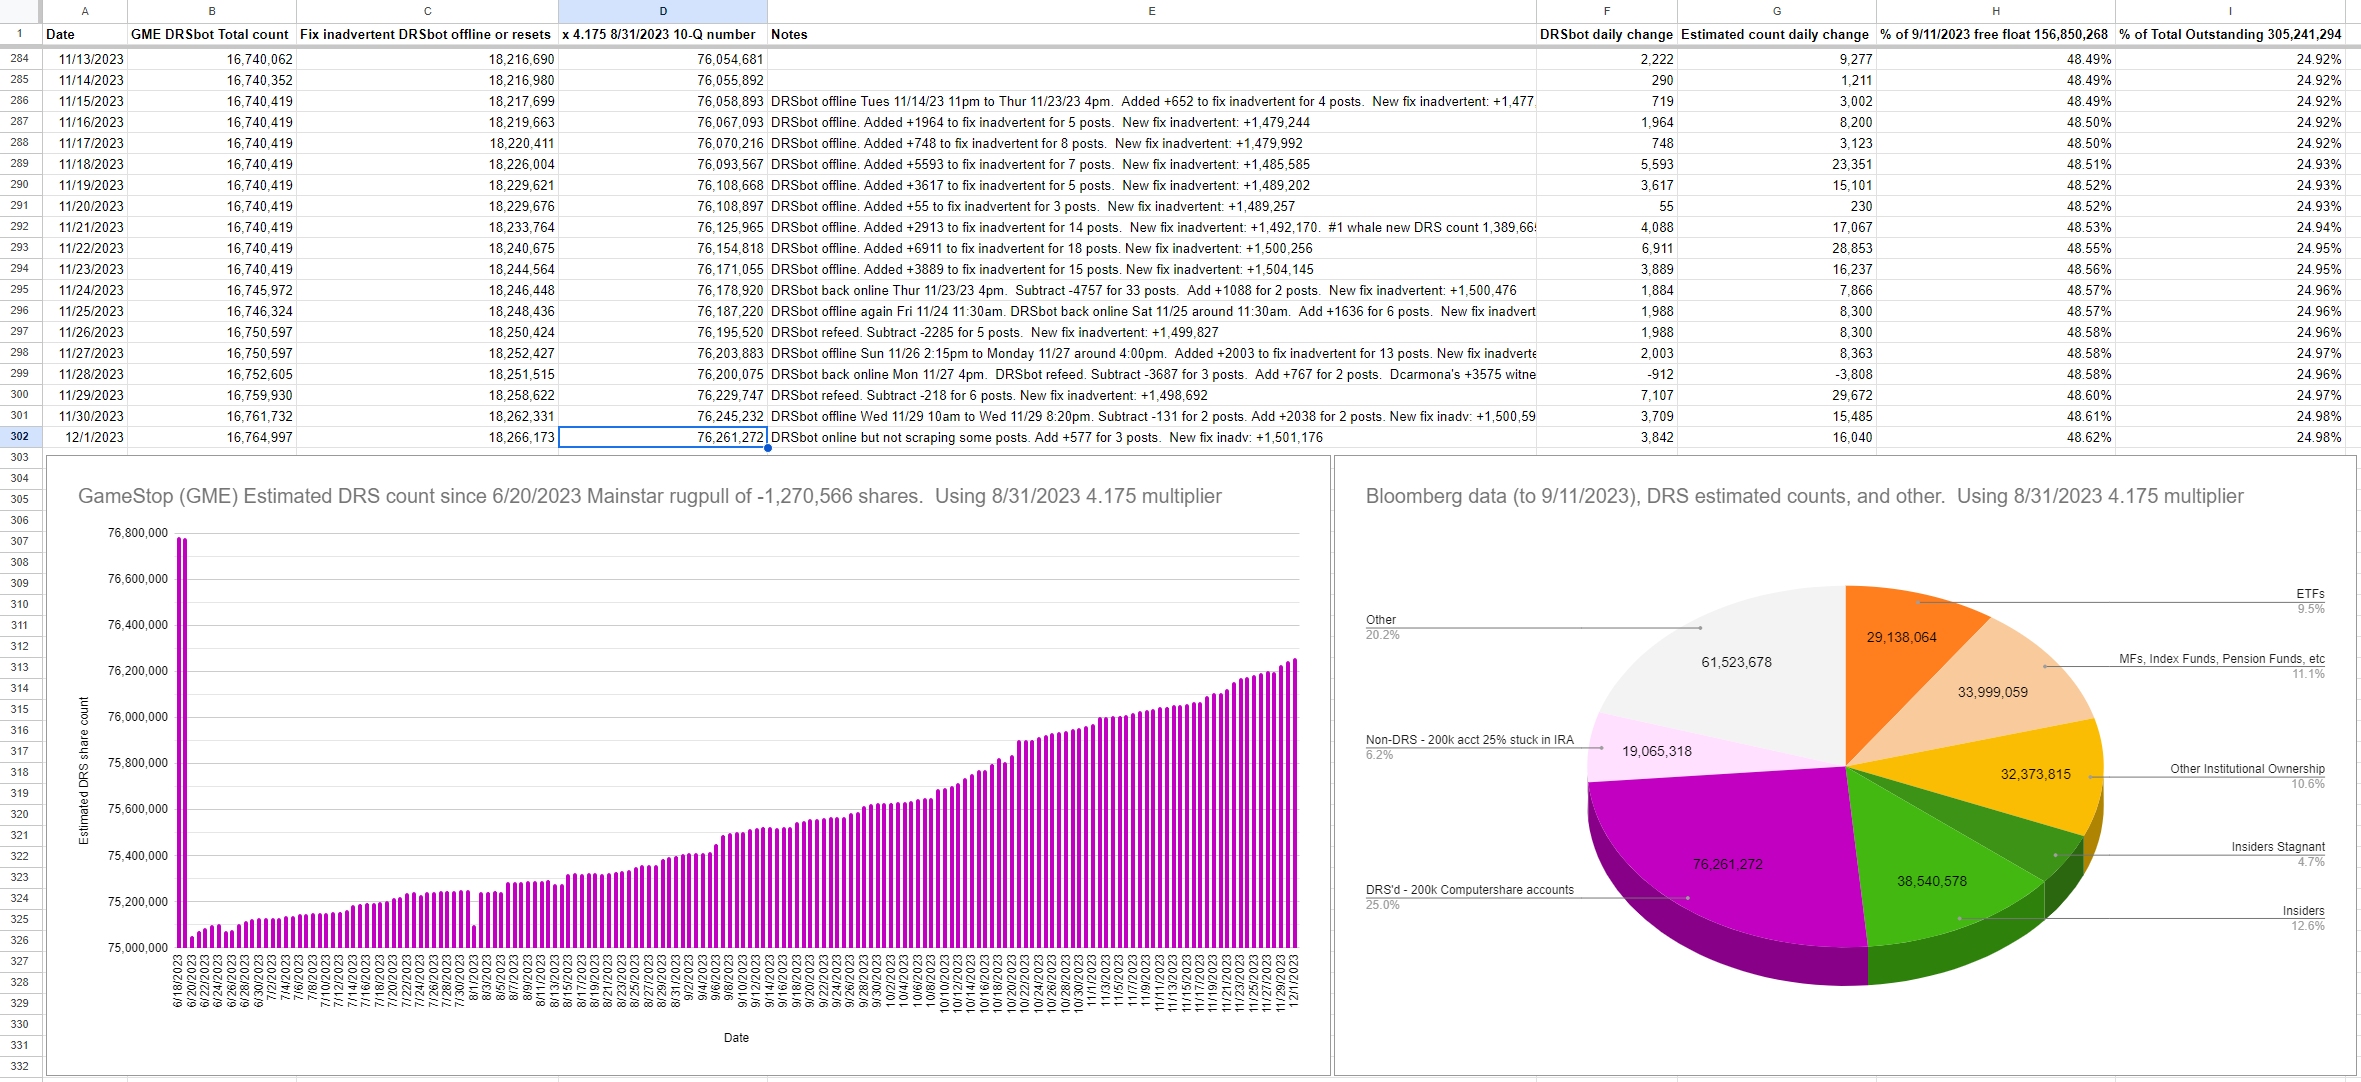
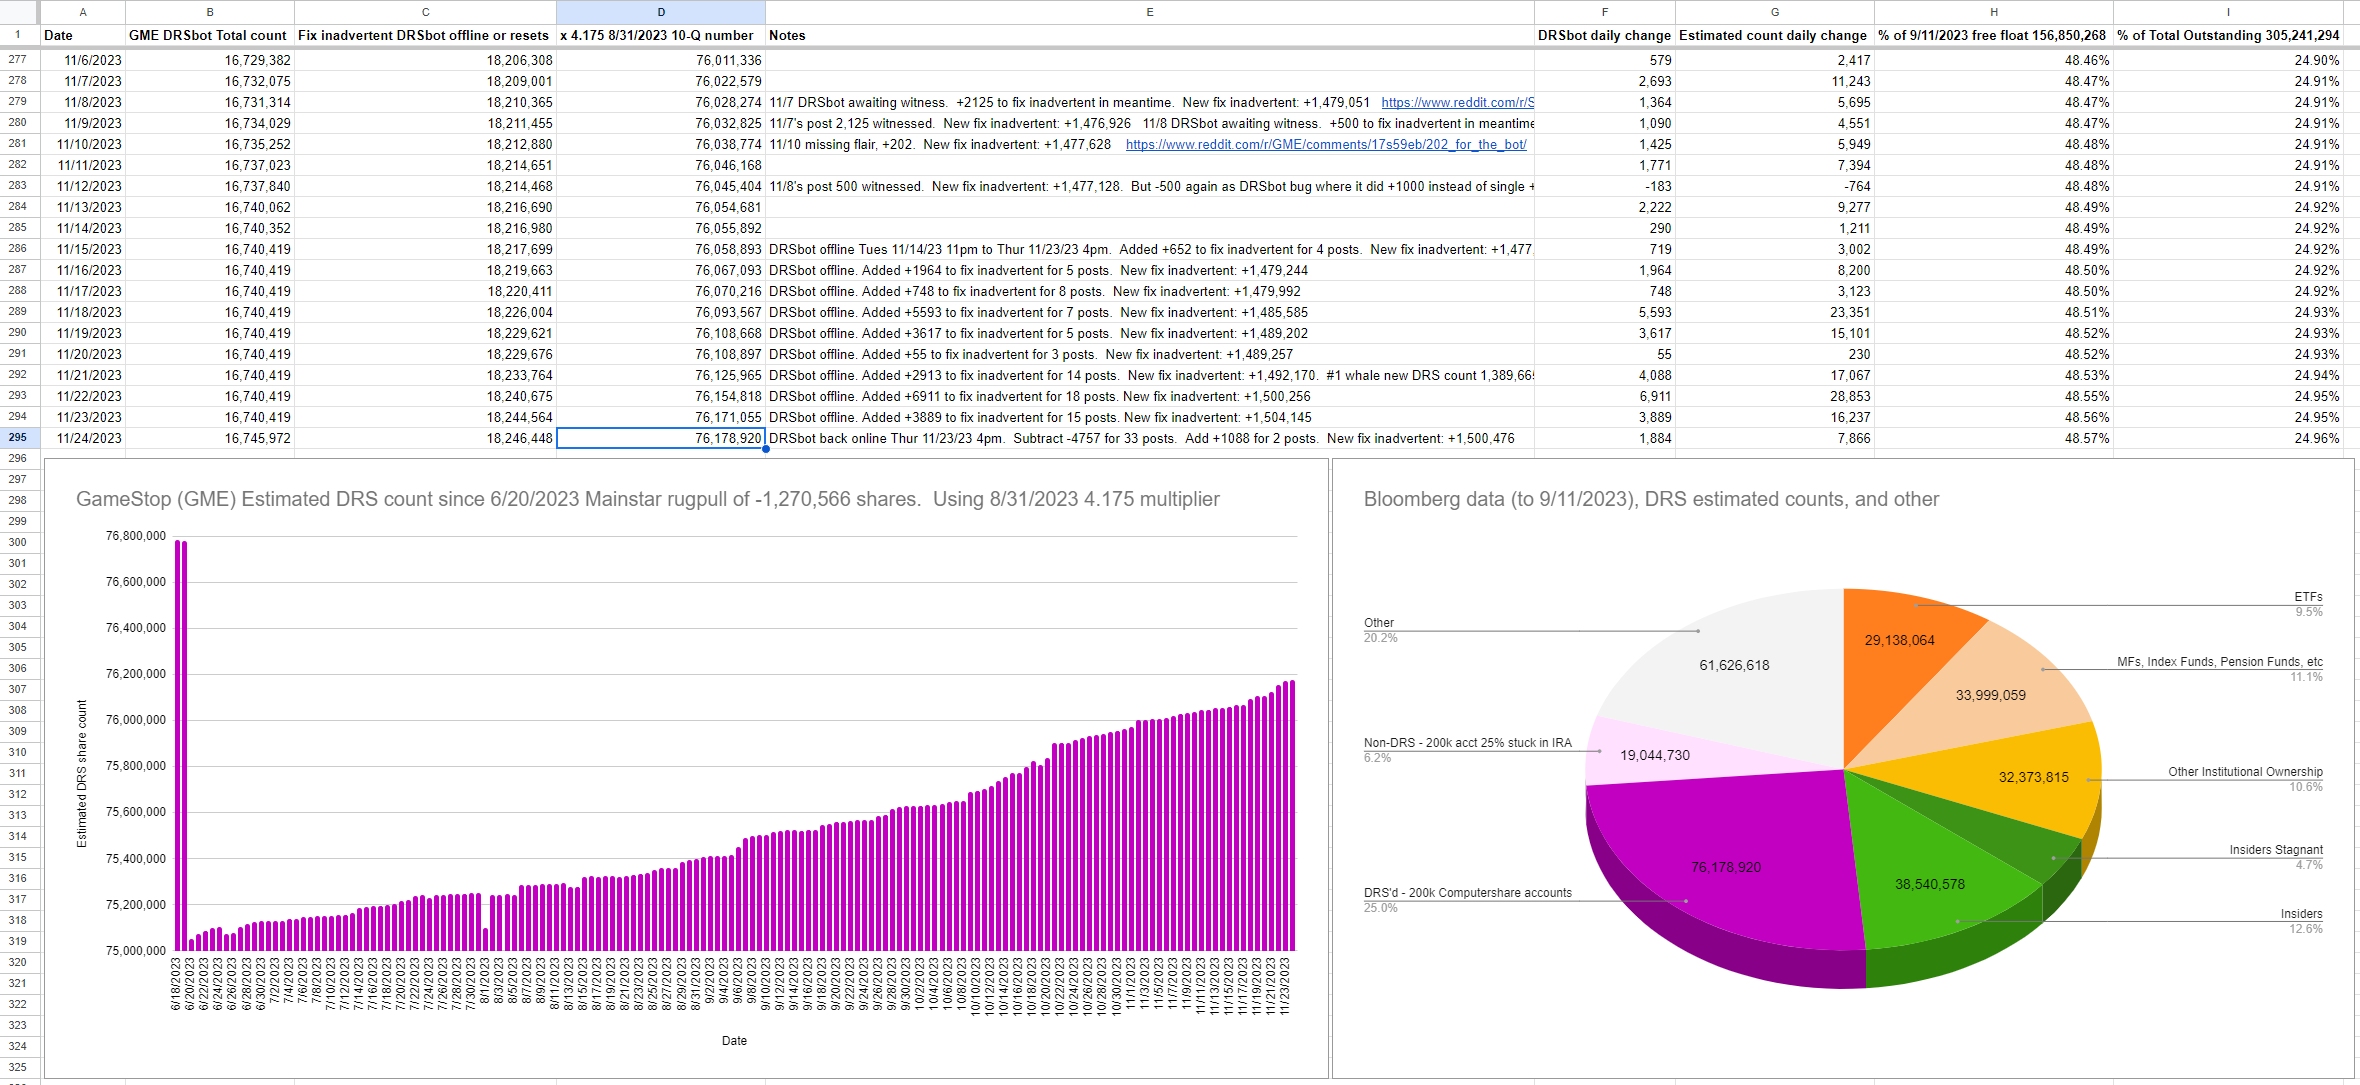
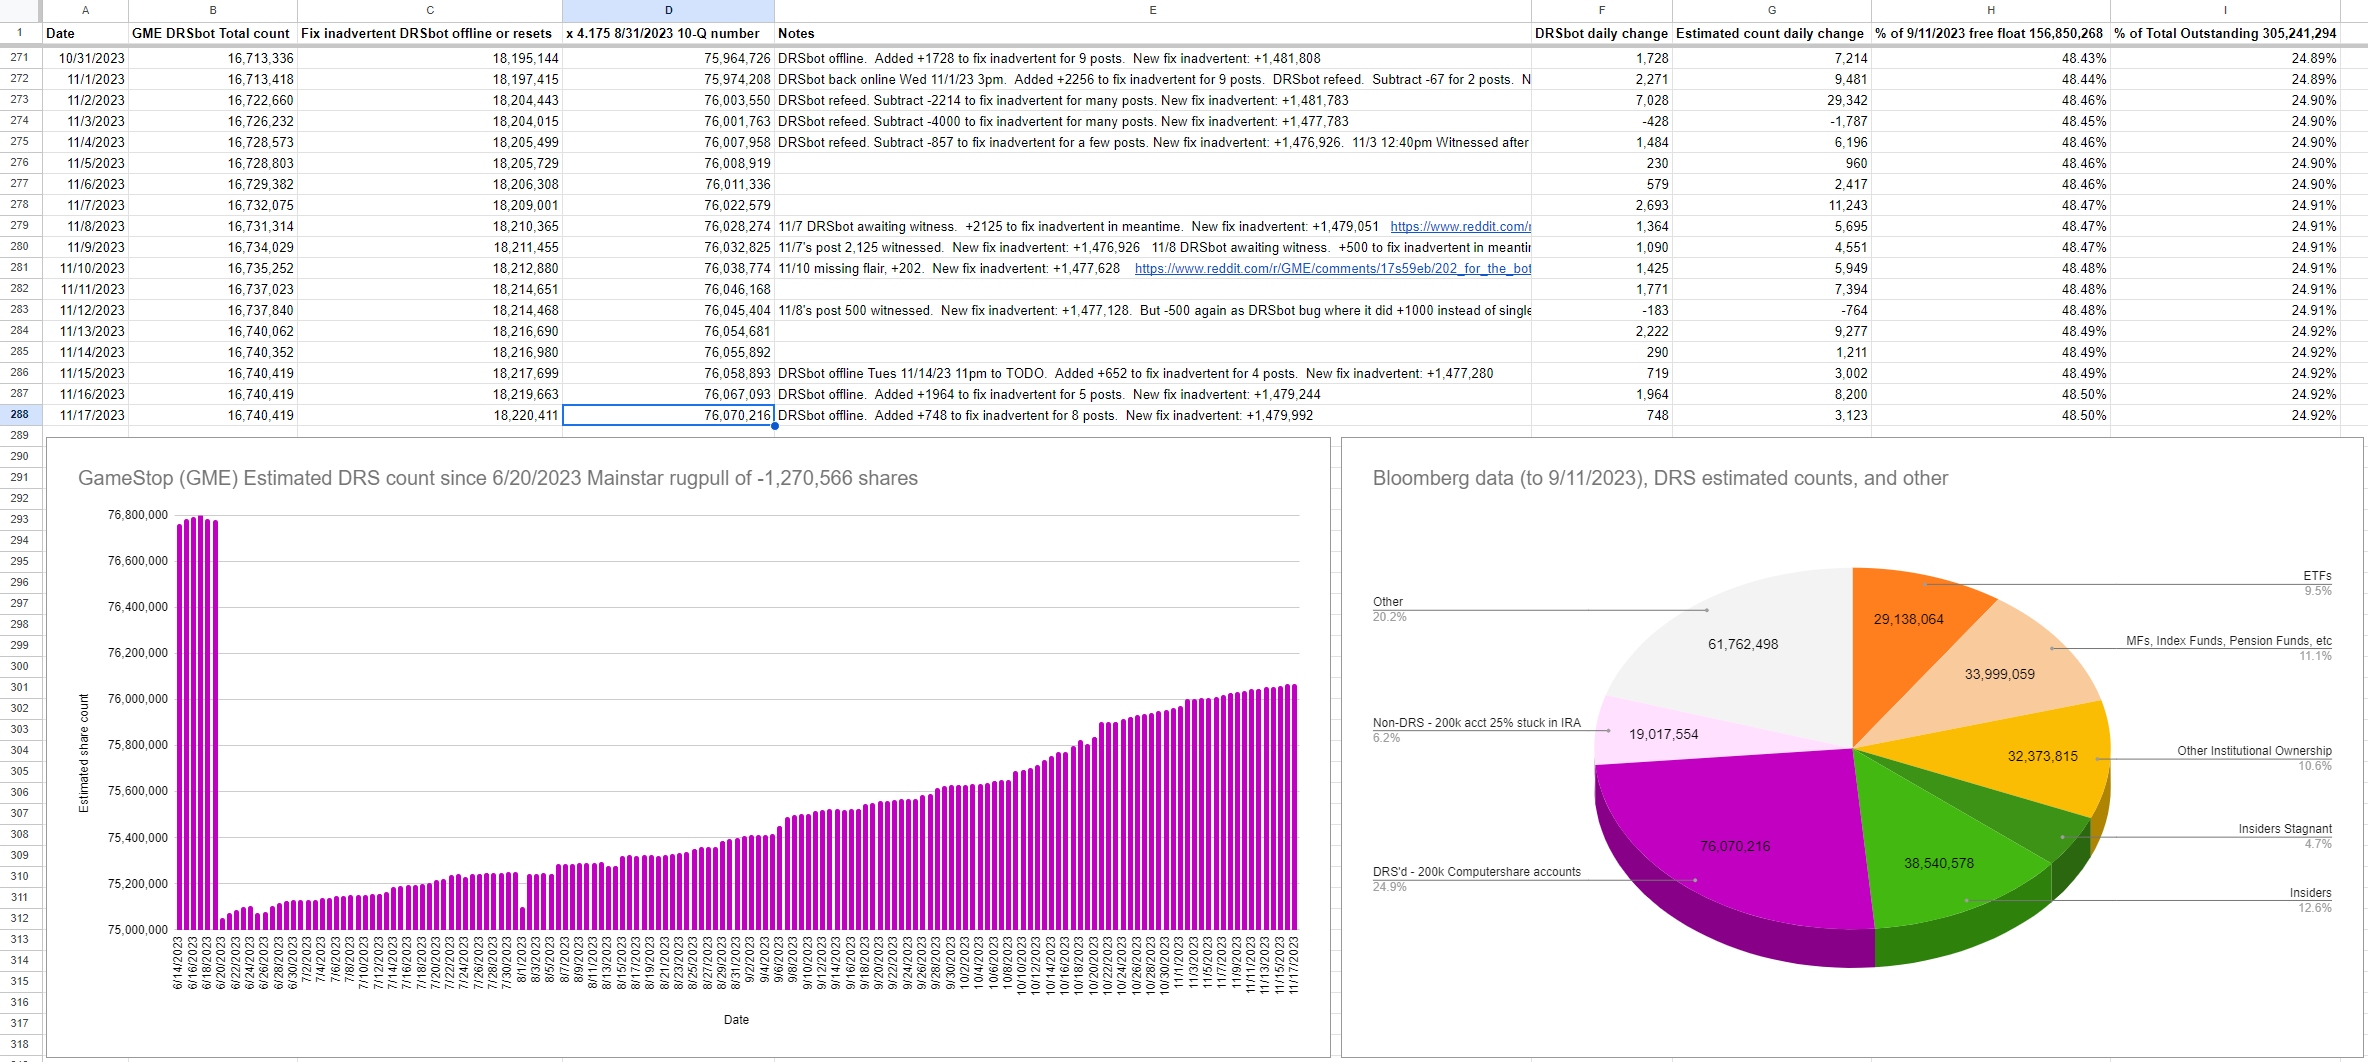
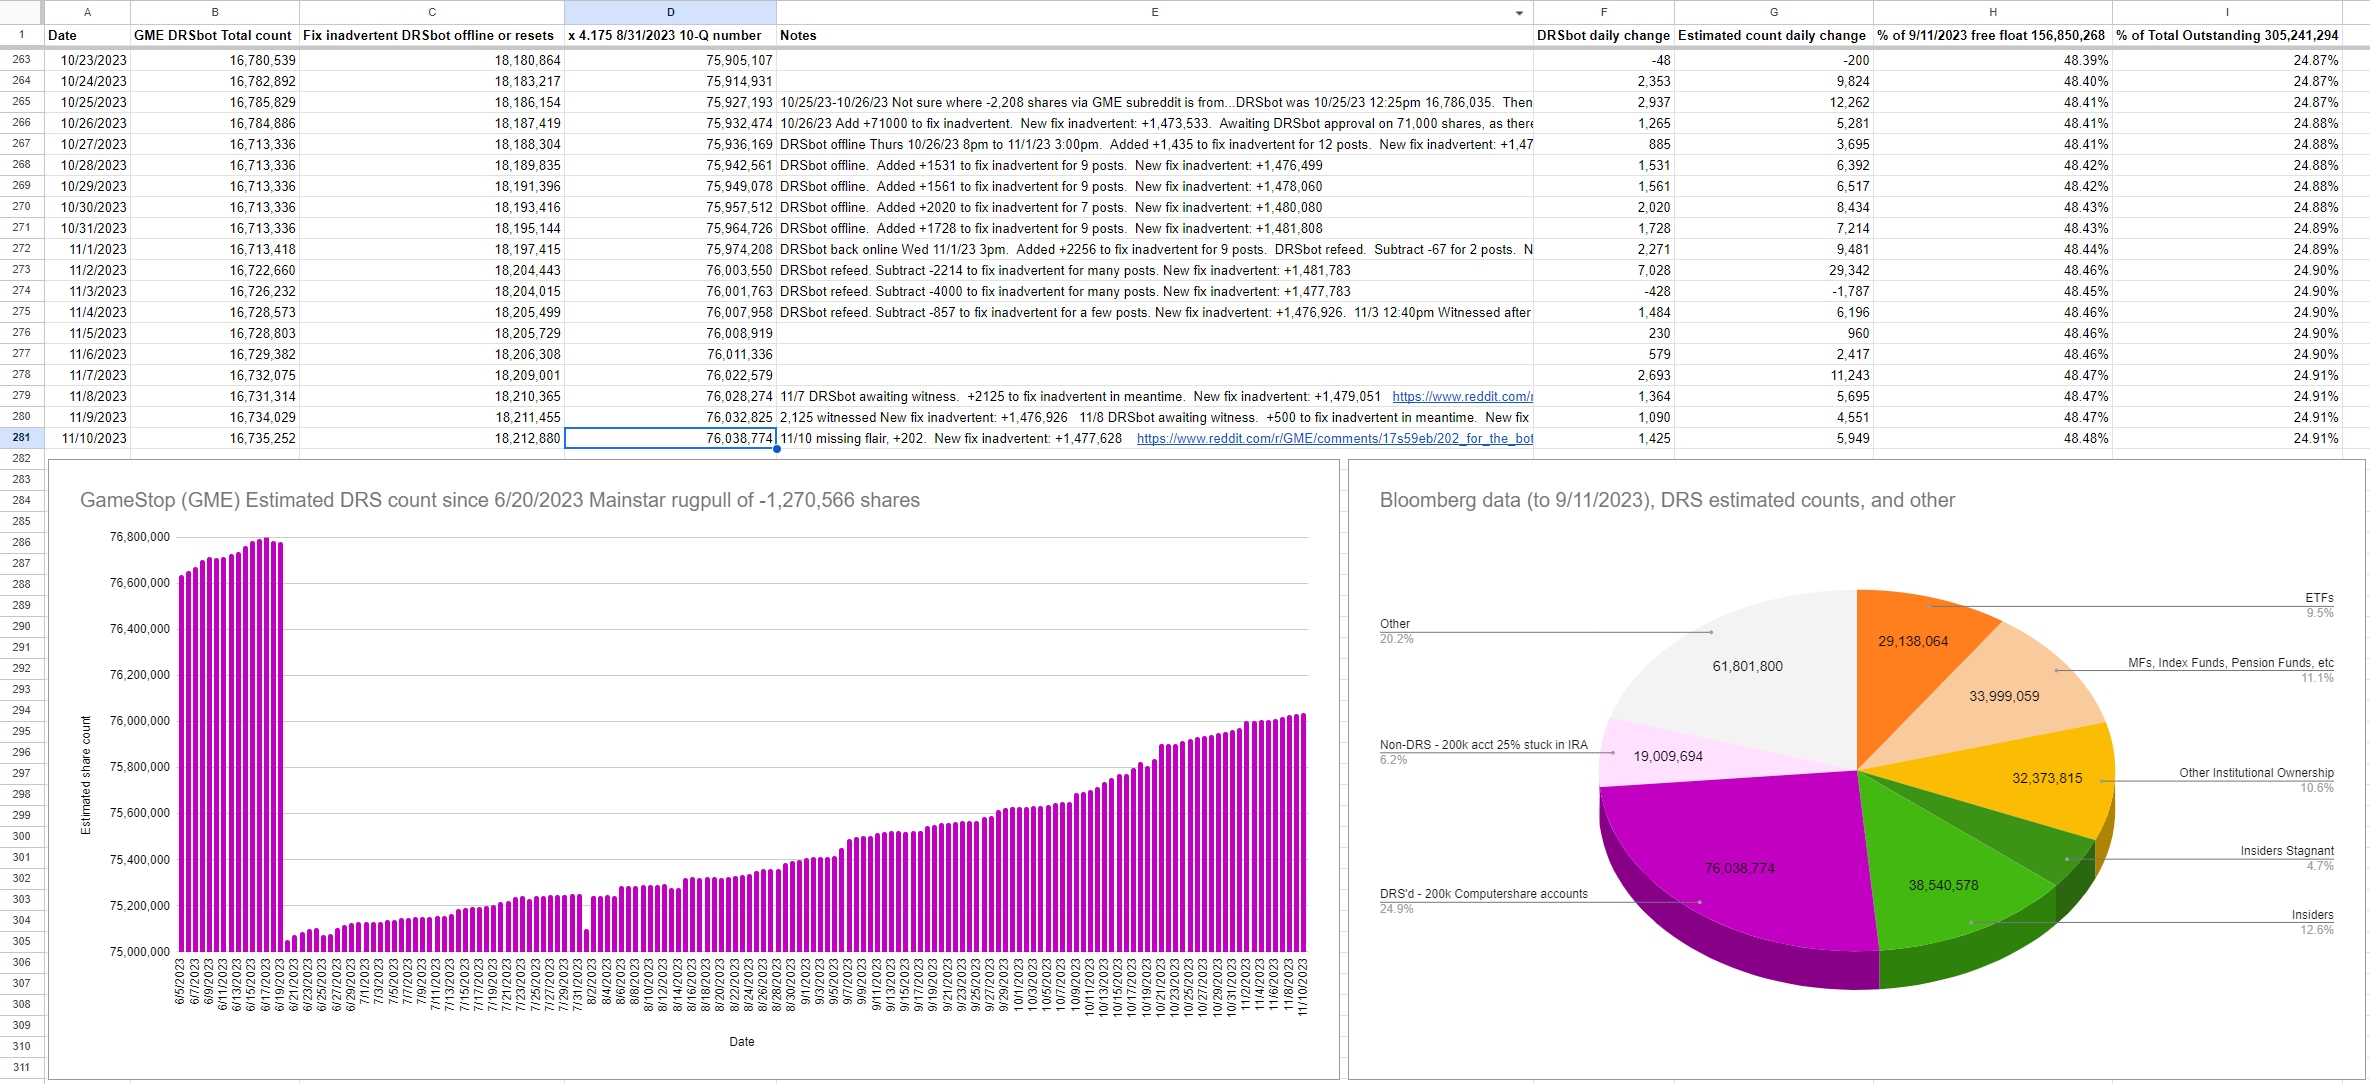
The DRS count incrementing 76.0m > 76.26m > 76.6m seems “ok, no ‘major’ f–kery” but still a bit on the low side. Which partly leads to questioning if we are overestimating retail investor purchasing power and how many are DRS-ing in that timeframe.
Without access to the Computershare dashboard to see daily account and count changes, we’re left in the dark guessing. Like the +4.2m for 3/22/2023 versus +.5m on 10/29/2022. One theory is “they” load up DRS accounts, then many months later drain shares to confuse retail.
Yeah, I wish the default Lemmy editor included tables like reddit’s Fancy editor. I copy-paste from my reddit post (in Markdown mode) and it preserves the tables over in Lemmy.
Thank you, adding inflation for next week’s post.
DRSbot witnessing is pretty much down to one reddit user now (shorthand we refer to as NoVac user).
DRSbot has been offline more than online the past 3 weeks. I manually track DRS posts during its offline time. From keeping an eye on DRS posts the past 3-4 months, nothing alarming jumps out.
Was discussing the DRS count f–kery tonight, and there isn’t much reason to measure and estimate when “they” can consistently mess with the DRS numbers over the past 2 years.
I think a better gauge may be estimating money spent by retail purchasing GME per quarter. It was around $1.2 million average per 6 recurring Computershare buys per quarter. Then say a massively conservative $200k per other trading day. So:
If average $1.2 million spent per bi-weekly purchase, and say $14 a share, multiply by 6 for one GME quarter:
- 1,200,000 / 14 = 85,714 shares * 6 = 514,284 shares
- The 6 recurring buys alone should add 514,284 DRS shares.
Other 54 trading days:
- $200,000 / $14 a share = 14,285 shares a day
- 54 * 14,285 = 771,390 shares
Total:
514,284 + 771,390 = +1,285,674 DRS shares a quarter.
There, done. I don’t have to look at another DRS post again, ever. :)
Yeah, the Youtube algorithm is interesting. I get recommended a bunch of AMC, stock market crash, and GME bashing videos sometimes.
Same with Reddit recommendations. I looked at 1 meltdown post maybe 14 months ago, haven’t looked at an AMC post in 2 years, but the algorithm still drums up meltdown and AMC posts on my main page.
I’ve watched Richard Newton’s youtube videos for a while. He’s been very helpful explaining what’s possibly happening via swaps, ETFs, OpEx, cycles, derivatives, etc. Also nice past videos explaining GameStop SEC filings, DRS, GameStop marketplace, former wallet, Loopring, ImmutableX, NFTs, ethereum, crypto, etc.
That’s where the SEC filing oddities kick in. Is it strange that 200,000 Computershare accounts are only progressing at:
- +500,000 DRS over 91 days (5,494 per day)
- +265,982 DRS over 30 days (8,866 per day)
- +334,018 DRS over 41 days (8,146 per day)
- +638,774 over 71 days (8,997 per day)
But simple math of when just ONE share a month for 200,000 accounts would be +600,000 a quarter?
It’s possible many of us are overestimating the 200,000 accounts’ purchasing power. Or something funny is going on.
This next Form 10-Q data point should be interesting!
I’d hazard a guess that we’re well past Other of 61,801,800 shares in brokerages.
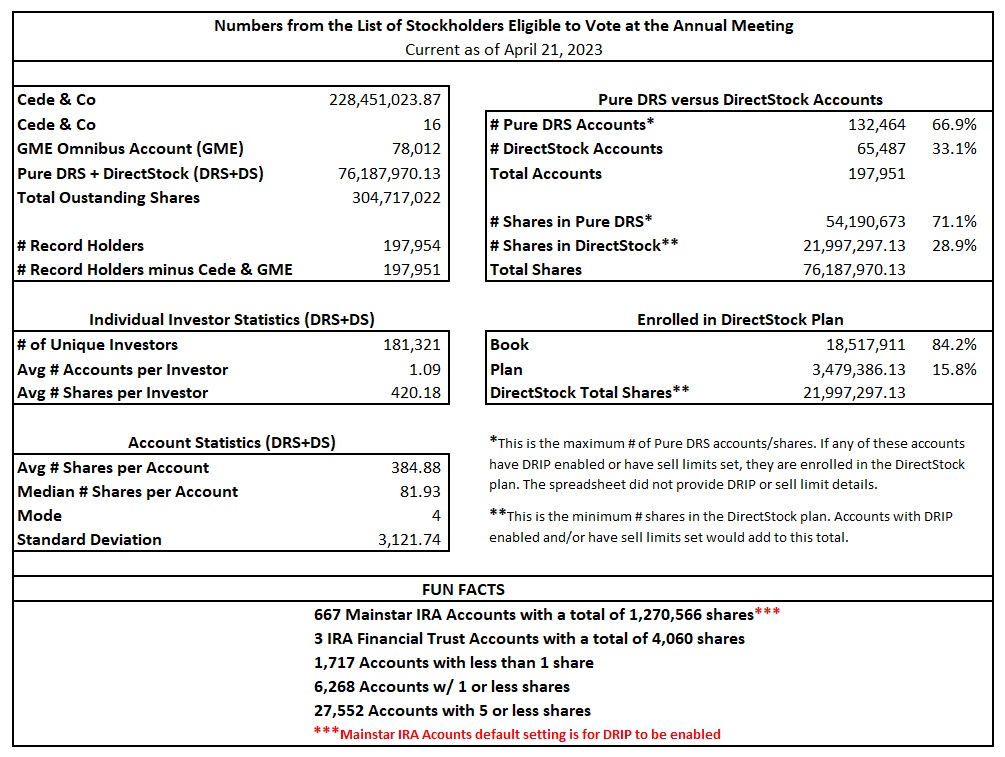
If only 200,000 Computershare accounts hold 76,038,774 plus non-conservative 50% additional stuck in IRAs (38,019,387) = 114,058,161 shares
Number of retail holders (non-Computershare account) Number of shares Total shares 2,000,000 50 100,000,000 4,000,000 50 200,000,000 2,000,000 100 200,000,000 2,000,000 150 300,000,000 2,000,000 200 400,000,000 2,000,000 250 500,000,000 2,000,000 300 600,000,000 2,000,000 350 700,000,000 4,000,000 175 700,000,000 I don’t think it’d be a stretch to say 4,000,000 retail holders each hold 50 shares = 200,000,000
29,138,064 + 33,999,059 + 32,373,815 + 14,339,510 + 38,540,578 + ~60,000,000 reported short + 114,058,161 + 200,000,000 = 522,449,187
If 4,000,000 hold 175 shares = 700,000,000. 522,449,187 + additional 500,000,000 = 1,022,449,187
Further ruminating, using very conservative numbers.
Not even using 200,000 Computershare accounts. Say just 100,000 accounts.
Is it a stretch to say 100,000 accounts DRS 5 shares a month? 100,000 x 5 shares a month x 3 months = 1,500,000 a quarter
5 shares a month * $22 avg = $110 a month * 3 months = $330 a quarter
Or only 1 to 3 shares a month for 200,000 accounts:
- 1 share a month = 600,000 a quarter
- 2 shares a month = 1,200,000 a quarter
- 3 shares a month = 1,800,000 a quarter
It seems the underlying question is if the DTCC has any effect on what Computershare provides GameStop for the DRS numbers.
I’m assuming Computershare the transfer agent keeps its own share count and provides the information to GameStop.
- Computershare -> GameStop
Assuming there is no DTCC step where the DTCC tells Computershare what’s on DTCC side, so Computershare has to fudge their numbers to match, then tell GameStop.
Has there been any information that shows the flow of share count data is:
- DTCC -> Computershare -> GameStop
If we include the non-official DRS numbers with the official GameStop SEC filings:
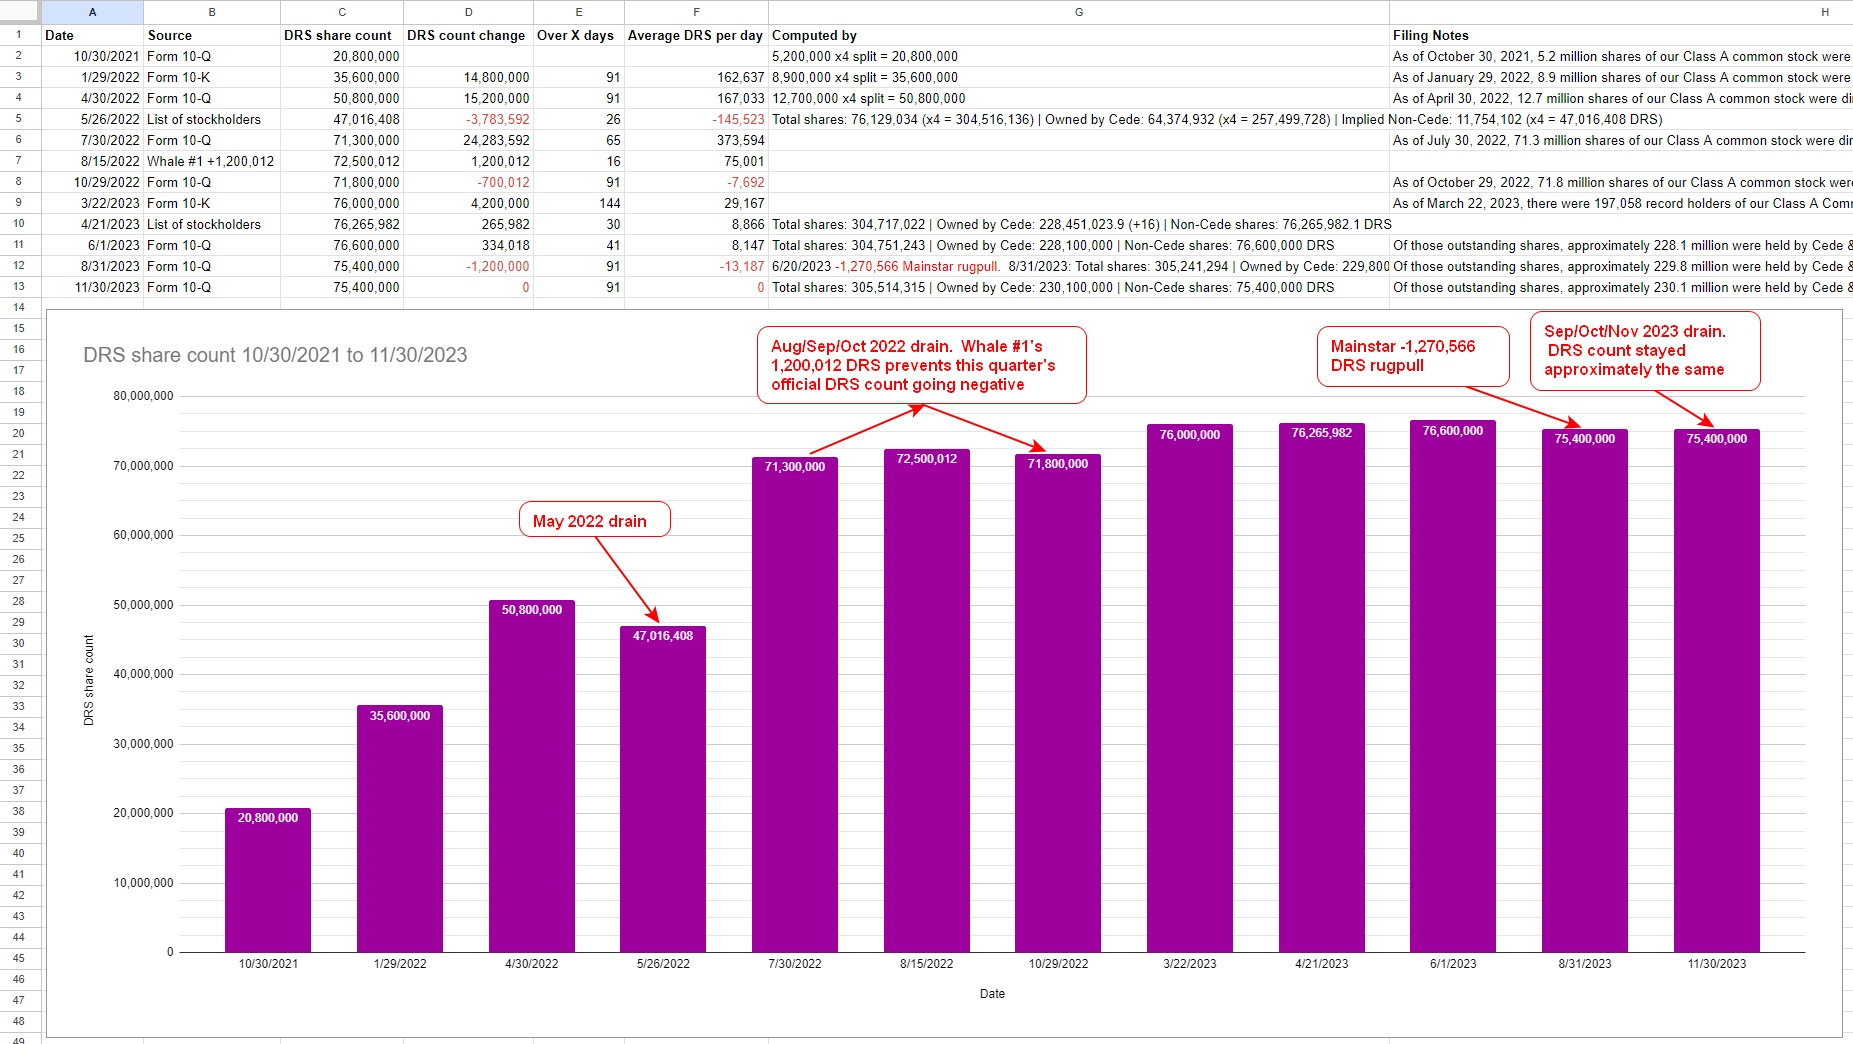
Date DRS in Millions Notes 10/30/21 20.80 SEC filing 01/29/22 35.60 SEC filing 04/30/22 50.80 SEC filing 05/26/22 47.01 List of stockholders 07/30/22 71.30 SEC filing 10/29/22 71.80 SEC filing 03/22/23 76.00 SEC filing 04/21/23 76.26 List of stockholders 06/01/23 76.60 SEC filing 06/20/23 75.33 Mainstar rugpull -1,270,566 08/31/23 75.40 SEC filing The May 2023 visit to GameStop HQ for the 04/21/23 list of stockholders numbers:
Using your numbers:
- 10/29/22 71.80
- 03/22/23 103.2382 - would be like 31.4 million shares times $25 average = $785,000,000
- 06/01/23 114.7828 - like 11.54 million shares times $21 average = $242,340,000
- 08/31/23 129.5794 - like 14.8 million shares times $22 average = $325,600,000
From a dollar amount $1,352,940,000 / 200,000 Computershare accounts = $6,765 each / $22 avg = +308 shares each over 10 months (31 shares a month).
Plausible, but it may be tough for the average holder to spend $676 a month on GME shares. And without the whales buying as much as they initially did, it skews the numbers down too.
Whoops, I think you may be misinterpreting the spreadsheet and graph I put together. I’ll rename the labels some and pick a less “Computershare purple” color in this week’s graph to clarify more.
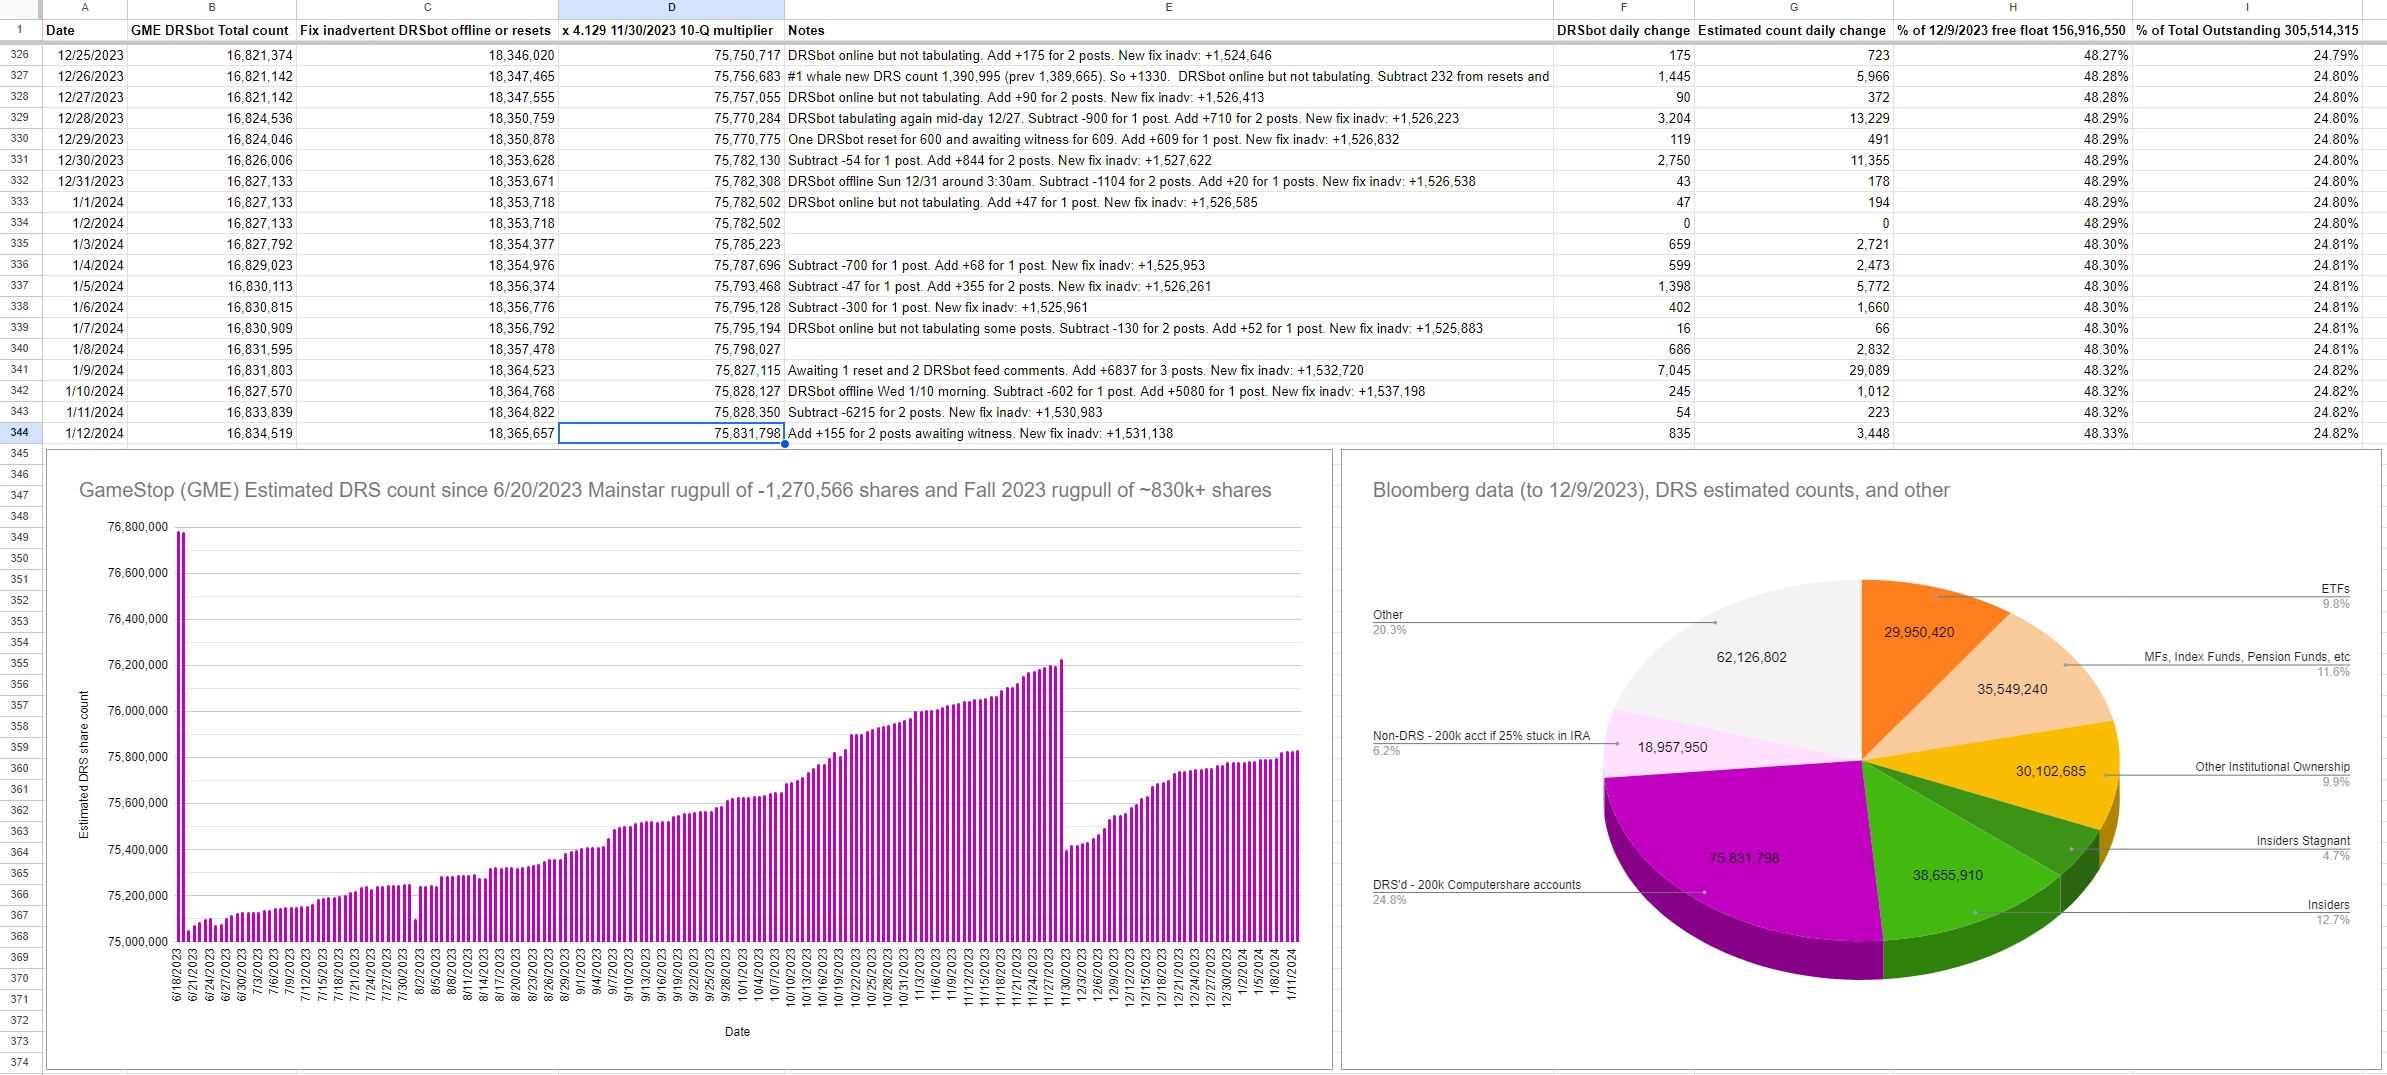
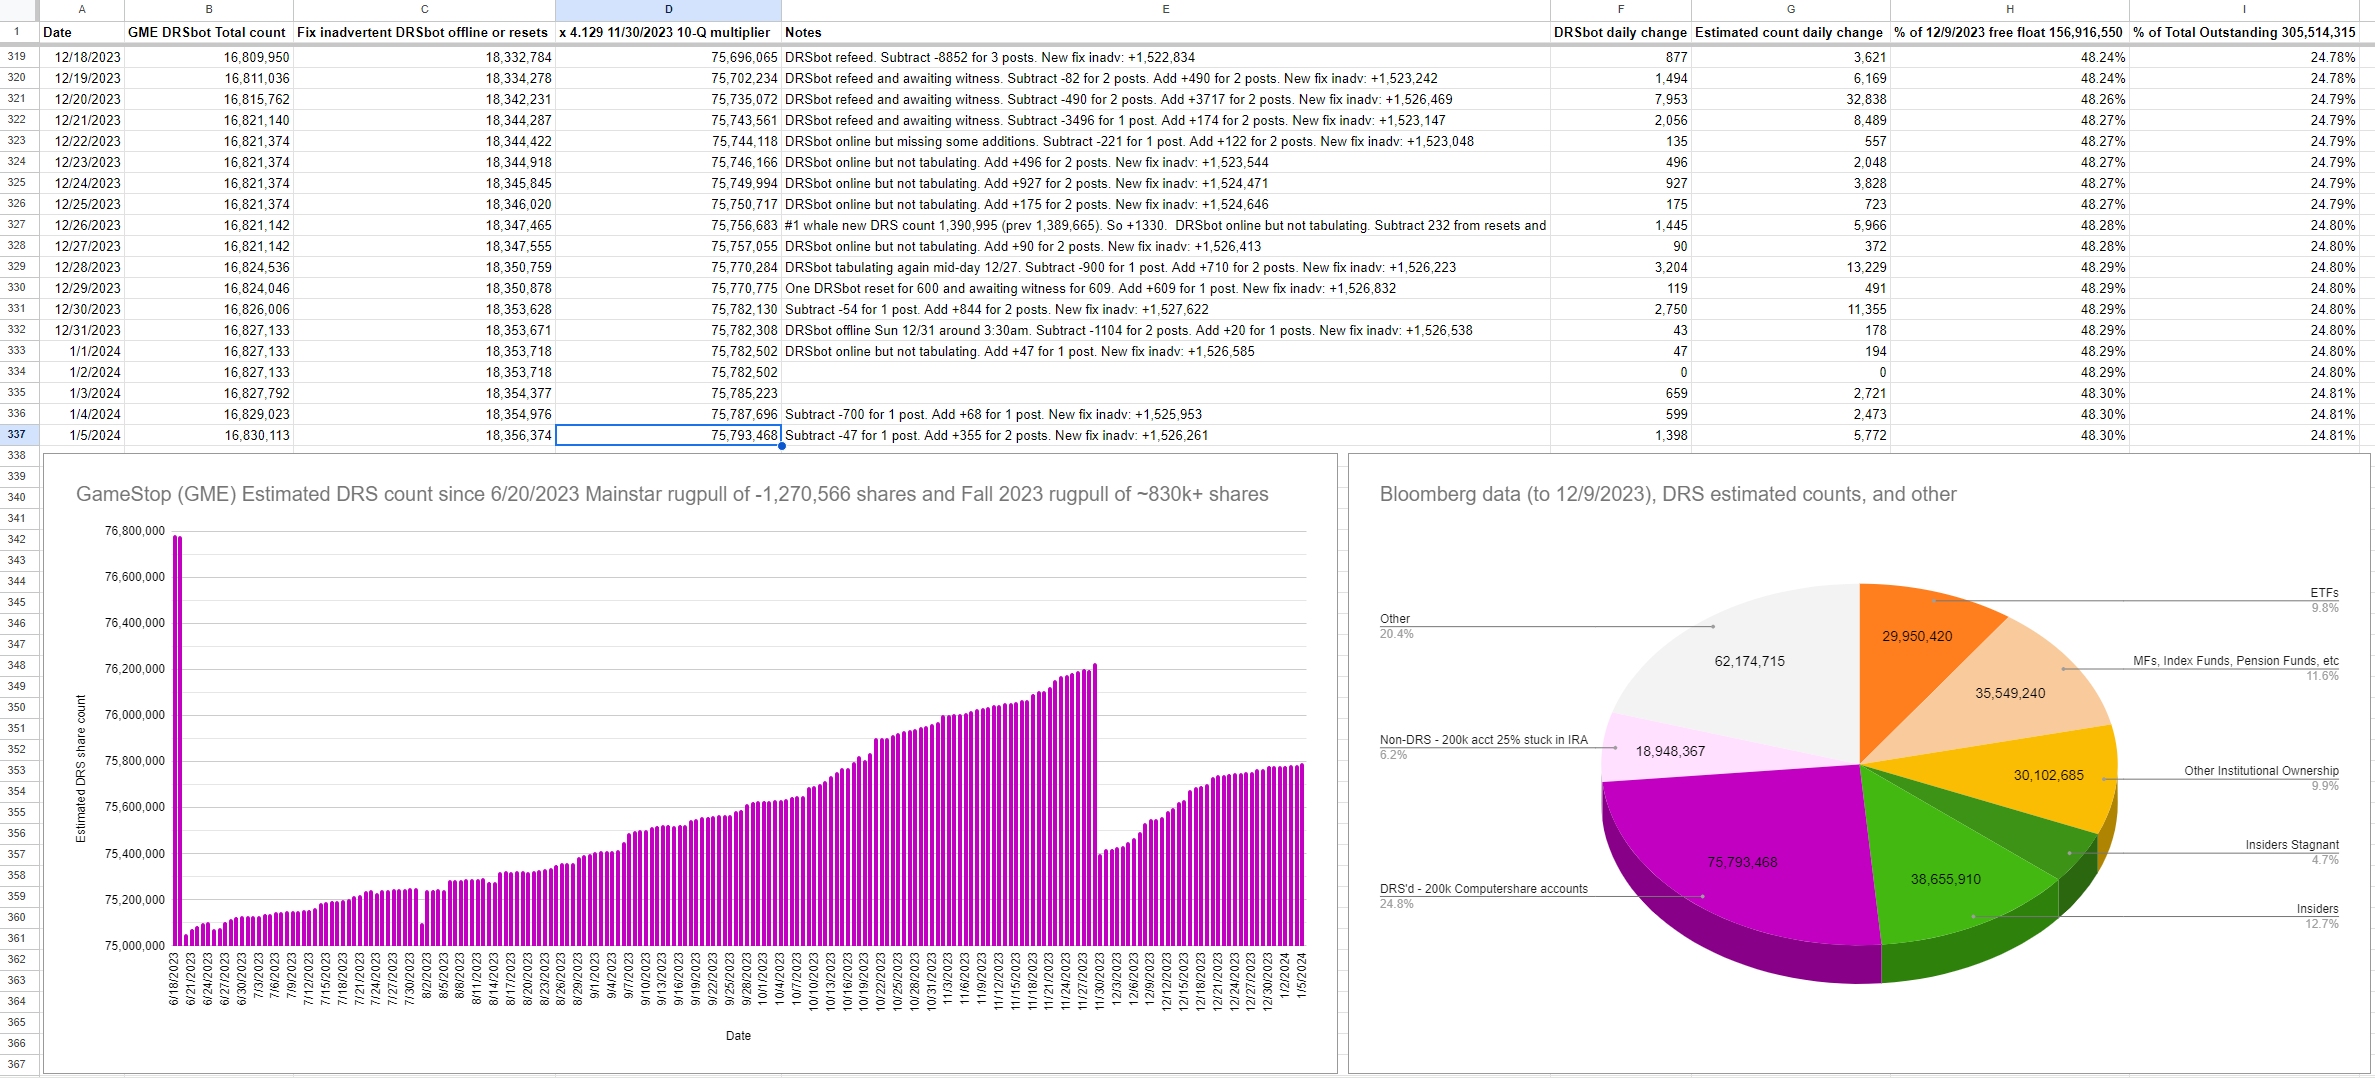
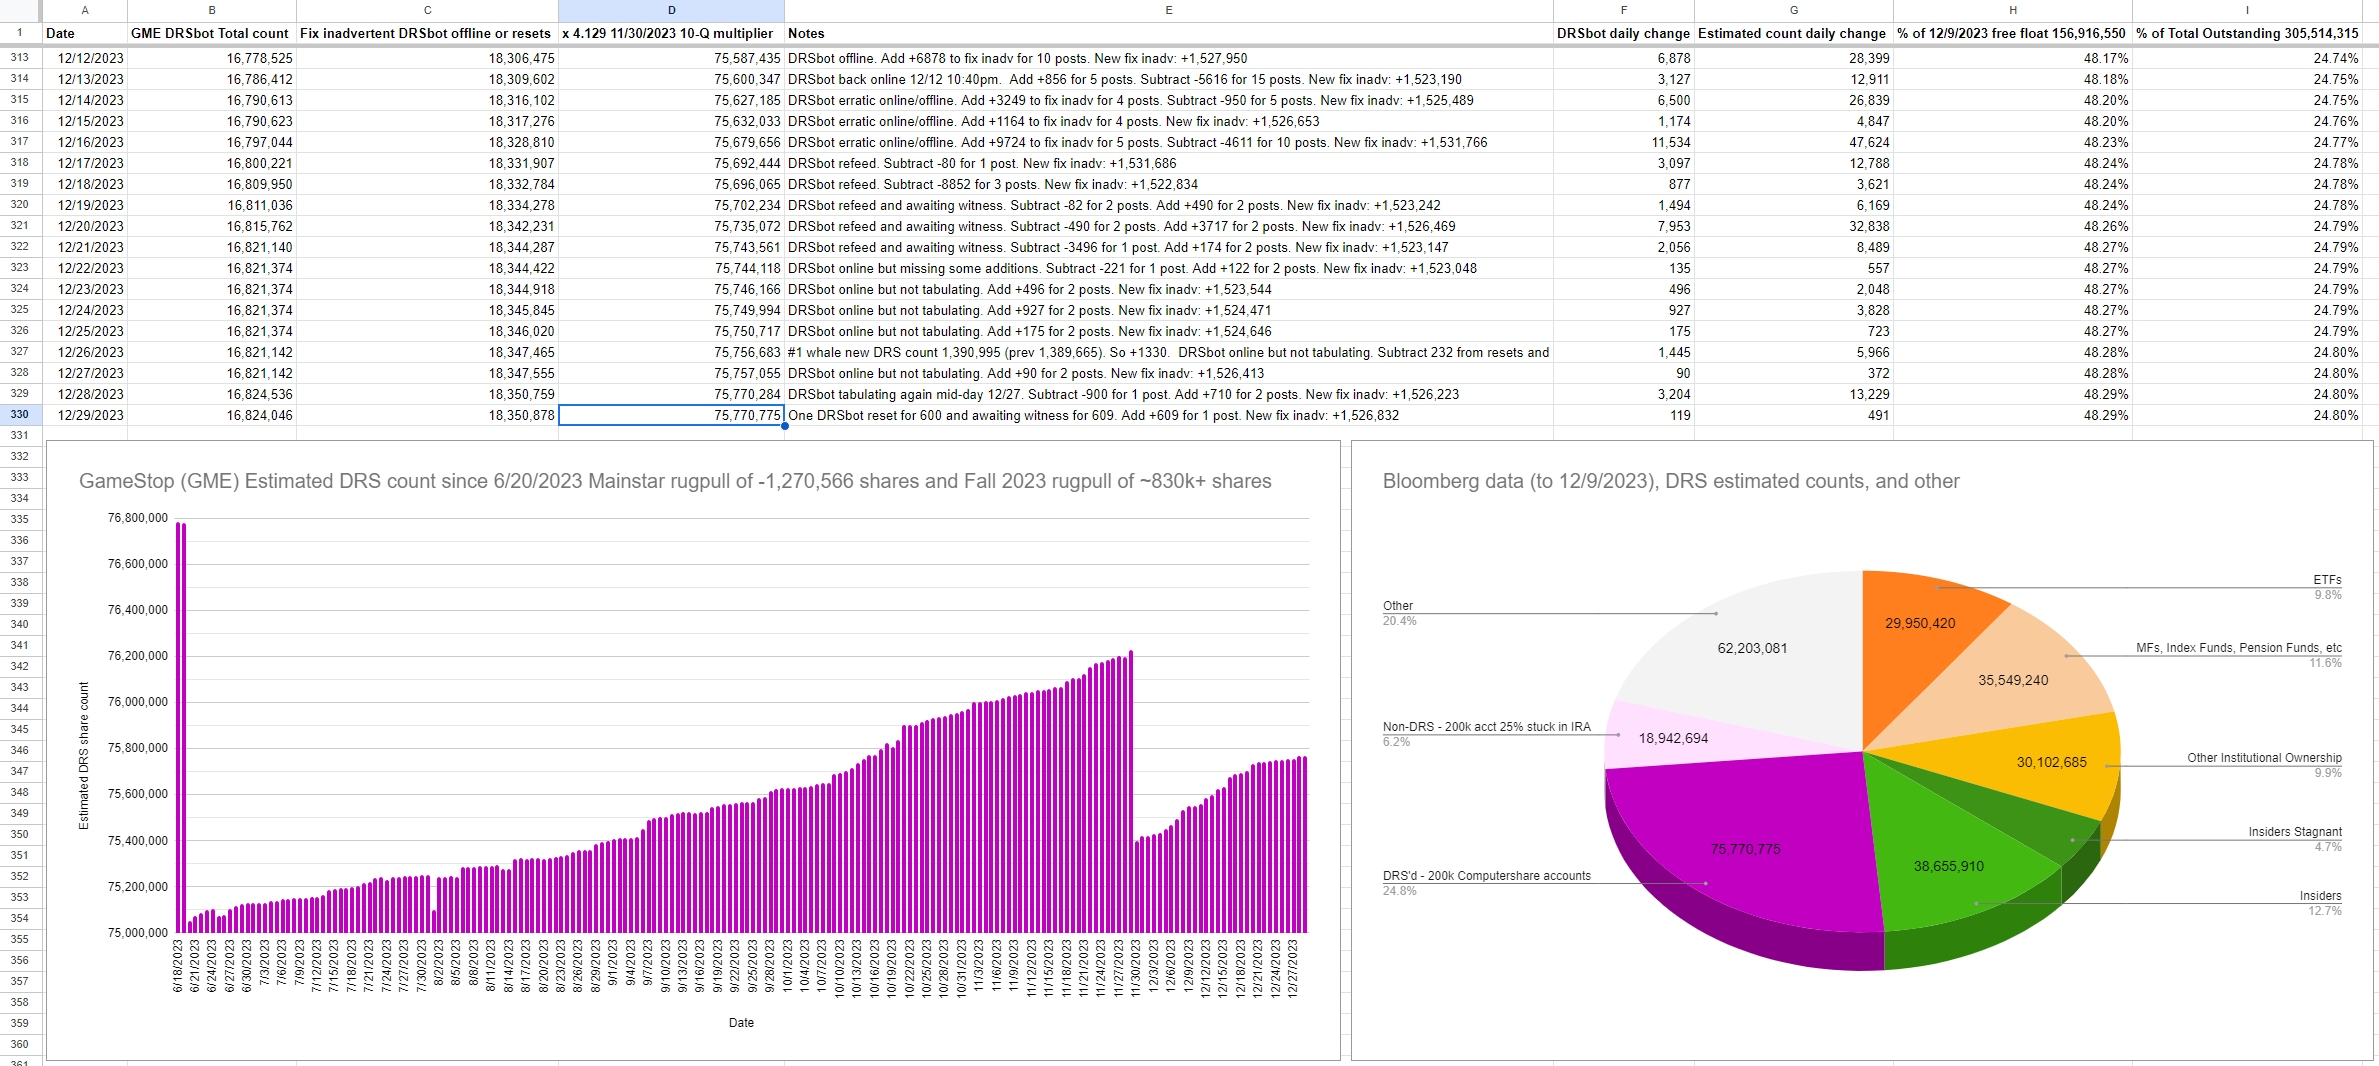
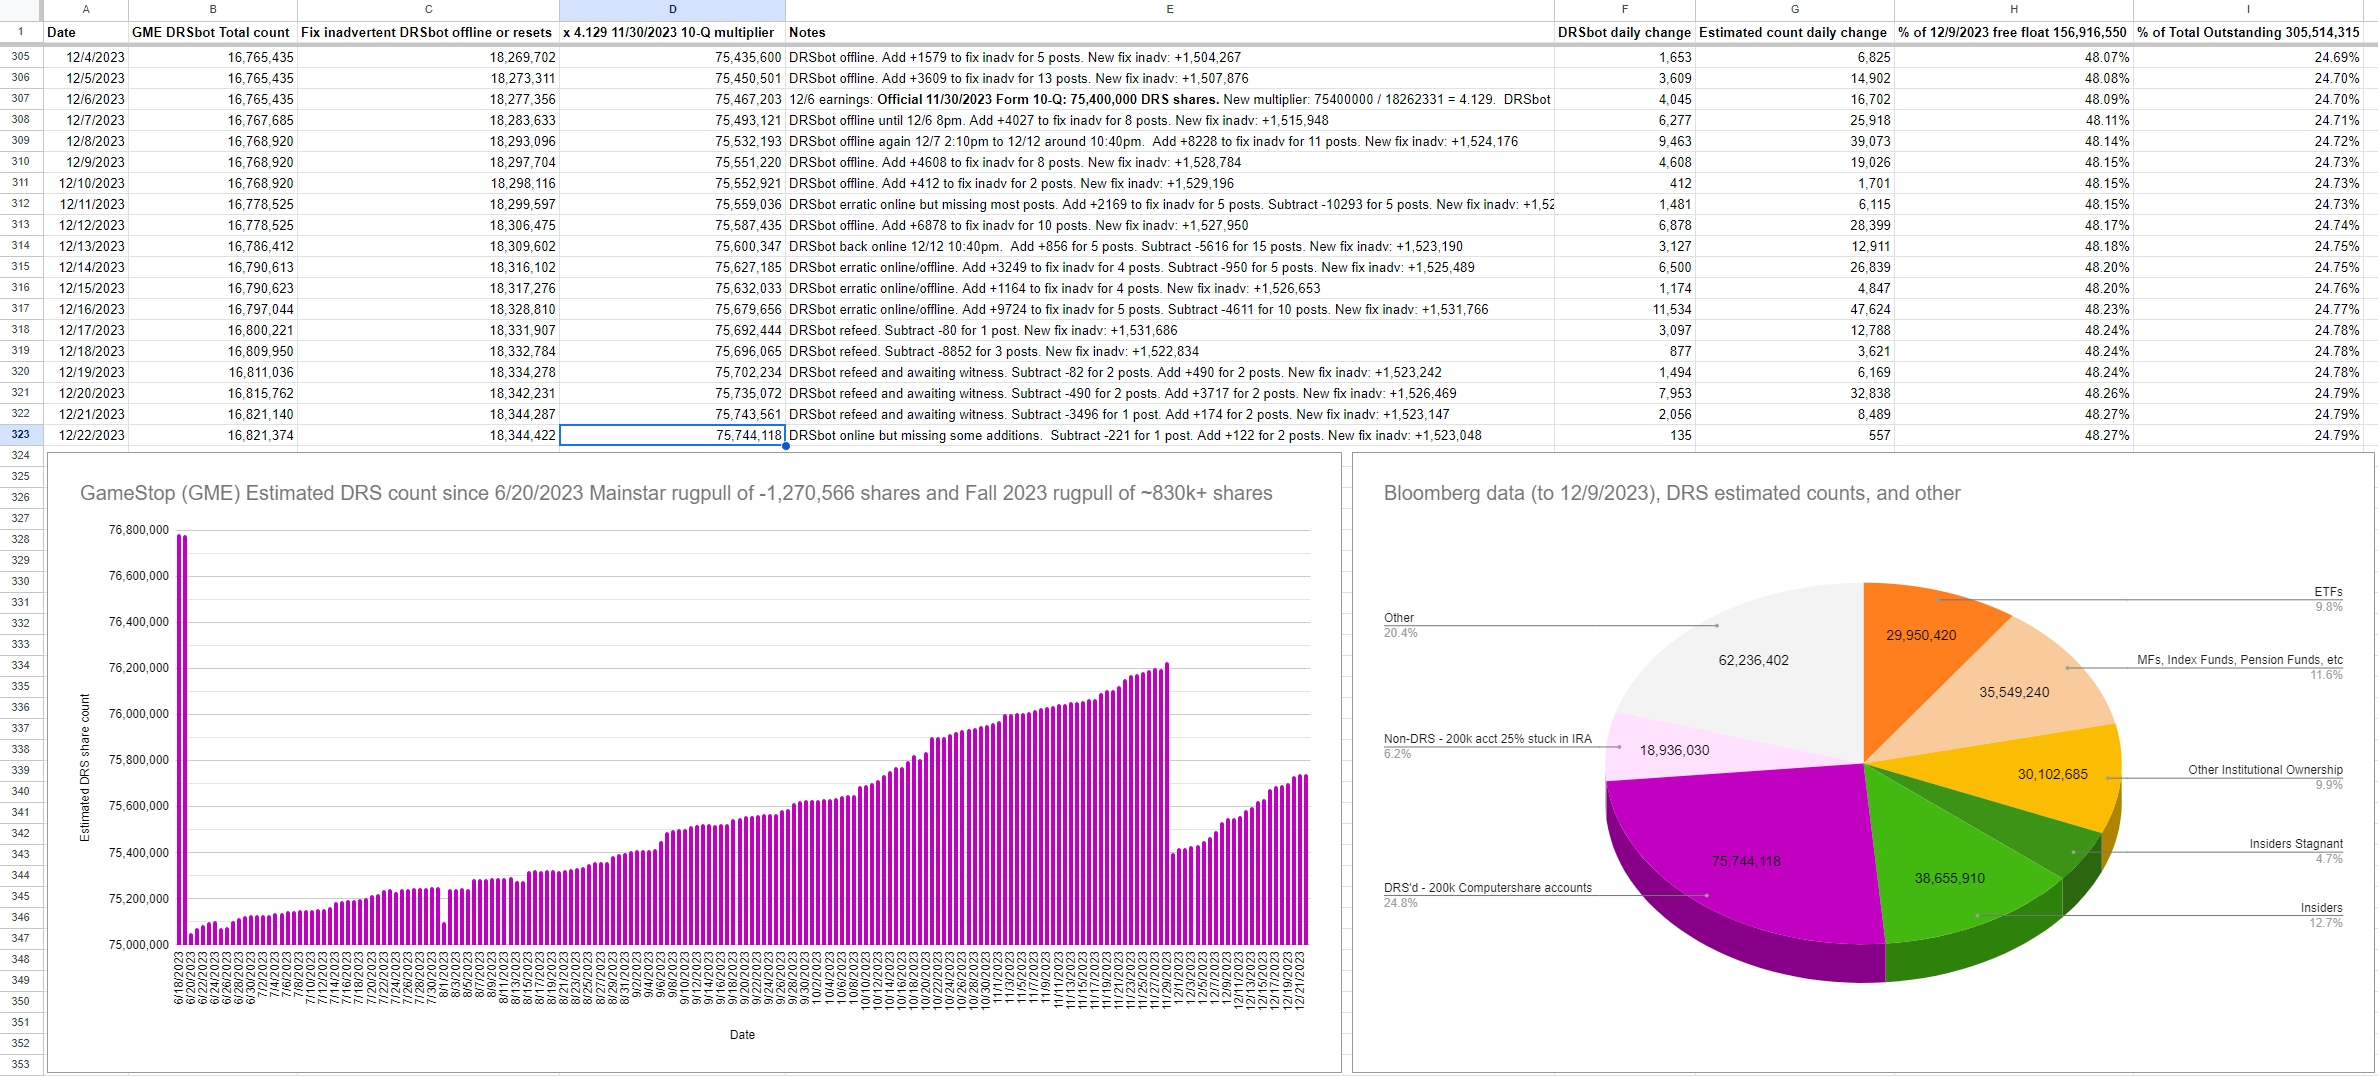
I wanted to highlight that just 200k Computershare accounts owned 75.5 million DRS shares. And these 200k CS accounts also have a conservative 25% more shares stuck in IRA accounts (not DRS’d). So 75.5 million DRS’d and 18.9 million stuck in IRA accounts. Rather than 85-90 million DRS’d in Computershare.
I was trying to convey that just 200k CS accounts hold 75.5 million DRS and 18.9 million in IRA accounts. And the “remaining 62 million shares” likely doesn’t add up if we think about the total number of retail brokerage, margin, and IRA accounts holding GME.
From Richard Newton’s google surveys. I’ll have to go through his recent videos–thought he mentioned 30-50% stuck in IRA accounts, etc but will double check.
Depends on your definition of stagnation. DRS is around 5,405 shares a day since 6/20/2023 Mainstar rugpull of -1.27 million shares.
The 38.54 million shares of Cohen, Nir, Alain, Lawrence, James, Xu, and Moore are either purchased in the market or granted from I believe the GameStop share pool. I think this pool’s number is listed somewhere in a SEC form.
From the last Form 10-Q the last 3 months ended July 29, 2023 the number of outstanding shares increased 600,000. For last 6 months it increased 700,000. Stock vests around the shareholder meeting. Something like 8,772 shares granted to each board member. And they’ve been awarding longer term store employees with shares the past year or so.
Others can explain number of shares far better than me. I think there were a couple reddit posts over the summer looking into the amount of shorts and shares over the outstanding.
lawsondt’s Bloomberg data post lists institutions holding GME. The usual suspects lending millions of shares out.
- @lawsondt@lemmy.whynotdrs.org 's post near the end explains Insiders Stagnant.
- From Richard Newton’s google surveys. I’ll have to go through his recent videos–thought he mentioned 30-50% stuck in IRA accounts, etc but will double check.
August 15, 2023 SS post: https://www.reddit.com/r/Superstonk/comments/15s0c2e/happy_13f_filing_day_apologies_for_quality/ I haven’t gone through the numbers on the screenshots, and I think someone mentioned one page was missing.
Old notes from DRSyourGME:
5/18/2023 numbers from lawsondt’s compilation:
- Outstanding Shares: 304,717,030
- ETFs: 29,268,180
- MFs, Index Funds, Pension Funds, etc.: 35,394,217
- Other Institutional Ownership: 46,228,722
- Insiders: 38,482,026
- Insiders Stagnant: 13,961,696
\
Then 6/13/2023 numbers after known adjustments:
- Outstanding Shares: 304,717,030 -> 304,751,243 Shares outstanding as of June 1, 2023 GameStop Form 10-Q
- ETFs: 29,268,180
- MFs, Index Funds, Pension Funds, etc.: 35,394,217
- Other Institutional Ownership: 46,228,722
- Insiders: 38,482,026 -> +10,000 +5,000 +190,638 +253,204 = 38,985,868
- Insiders Stagnant: 13,961,696
8/15/2023 look again for free float number:
Free float: 304,751,243 - 29,268,180 - 35,394,217 - 46,228,722 - 38,985,868 - 13,961,696 = 140,912,560
8/23/2023 Estimated DRS count: 77,089,291
8/23/2023 Estimated DRS count minus 1,270,566 Mainstar rugpull shares: 75,818,725
There probably still is “something funny” going on. There is still the unexplained weird jumps up/down in DRS numbers since we first started:

I think we’re still chipping away the last 2 quarters and this coming quarter. Without some whales adding a large chunk this quarter, it looks like averaging around 6,150 DRS a day.
And we had the Mainstar rug pull. Odd timing on that.
And many ETFs containing GME still getting smashed into the dirt with piles of FTDs.
A few redditors have noticed where users do a drsbot reset, their share count goes to 0, then they try to re-add their shares. But then no drsbot witnesses approve their shares. Or the person doesn’t want to go through the approval process again. So we see share count go down like 34,000 or a few thousand shares, but then never get added back.
I manually fixed the #1 whale’s 1.3 million share count. Then this past week started adding back the 34,000+ shares of another whale. I’m too lazy to go through every DRS post looking for discrepancies where smaller amounts of shares don’t get added back. :\
Are you me? 😄 I was looking over the 10-Q (again) on Friday night. More of a “How is the stock price down 65% since stock split via dividend when all the SEC filing numbers are better than ever?”
We all know the answer, but I just have to remind myself.