
Awesome WHYDRS team. Thanks for your work!
I feel this work is early, but spot on. GameStop can set the precedent for household investors waking up, realizing how the market works and with DRS have a relatively easy way to really impact the market.
As the question bothered me if GameStop is such an outlier or more or less business as usual, I gathered data and did some graphs. I never really finished or published them, cause I feel that still with GameStop and DRS we are testing an hypothesis and the result is still to be seen (successful business & high DRS & huge shorts should positively corelate with the price). Why start DRSing other stocks if the impact of the “biggest DRSing community” is still not really proven. At the same time, if the hypothesis proofs to be right, other stocks will follow.
However, I feel that here might be the place to share the drafts for Days /w FTD, 10y Turnover and daily average FTDs (as % of shares outstanding). I also did some other analysis, like price elasticity. This is not financial advice, also please proof and test the numbers, I might have made errors.
Sources:
- For Days with FTD and daily FTD the SEC data was used: https://www.sec.gov/data/foiadocsfailsdatahtm
- For Shares Outstanding the SEC API was used: https://data.sec.gov/api/xbrl/companyconcept/[CIK]/DEI/EntityCommonStockSharesOutstanding.json (where the CIK of the ticker is derived from https://www.sec.gov/Archives/edgar/cik-lookup-data.txt)
- The Volume was fetched using yahoo finance
- All data was curtailed for 2012 to 2022 (Q3), so about 10 years
- ETFs were filtered out
- Only the top ~400 tickers as of days with FTDs were used
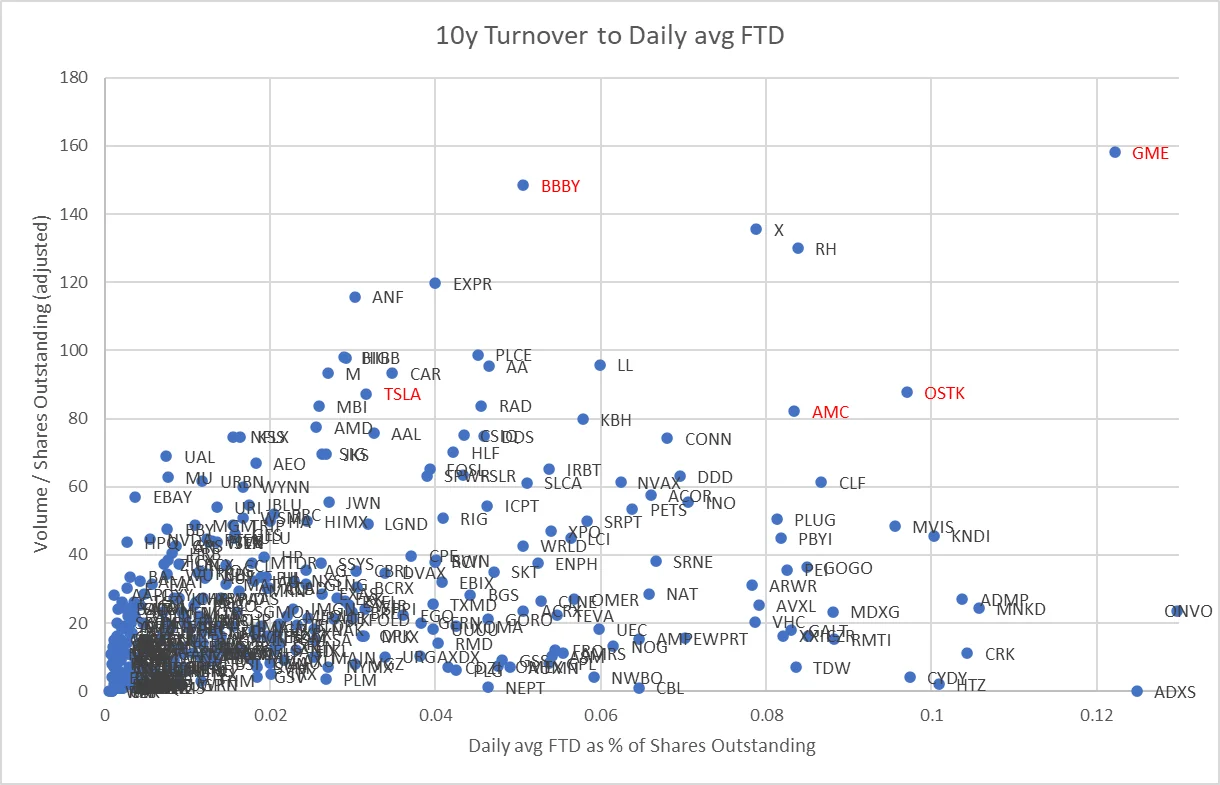
10y Turnover (volume / shares oustanding) to Daily avg FTD
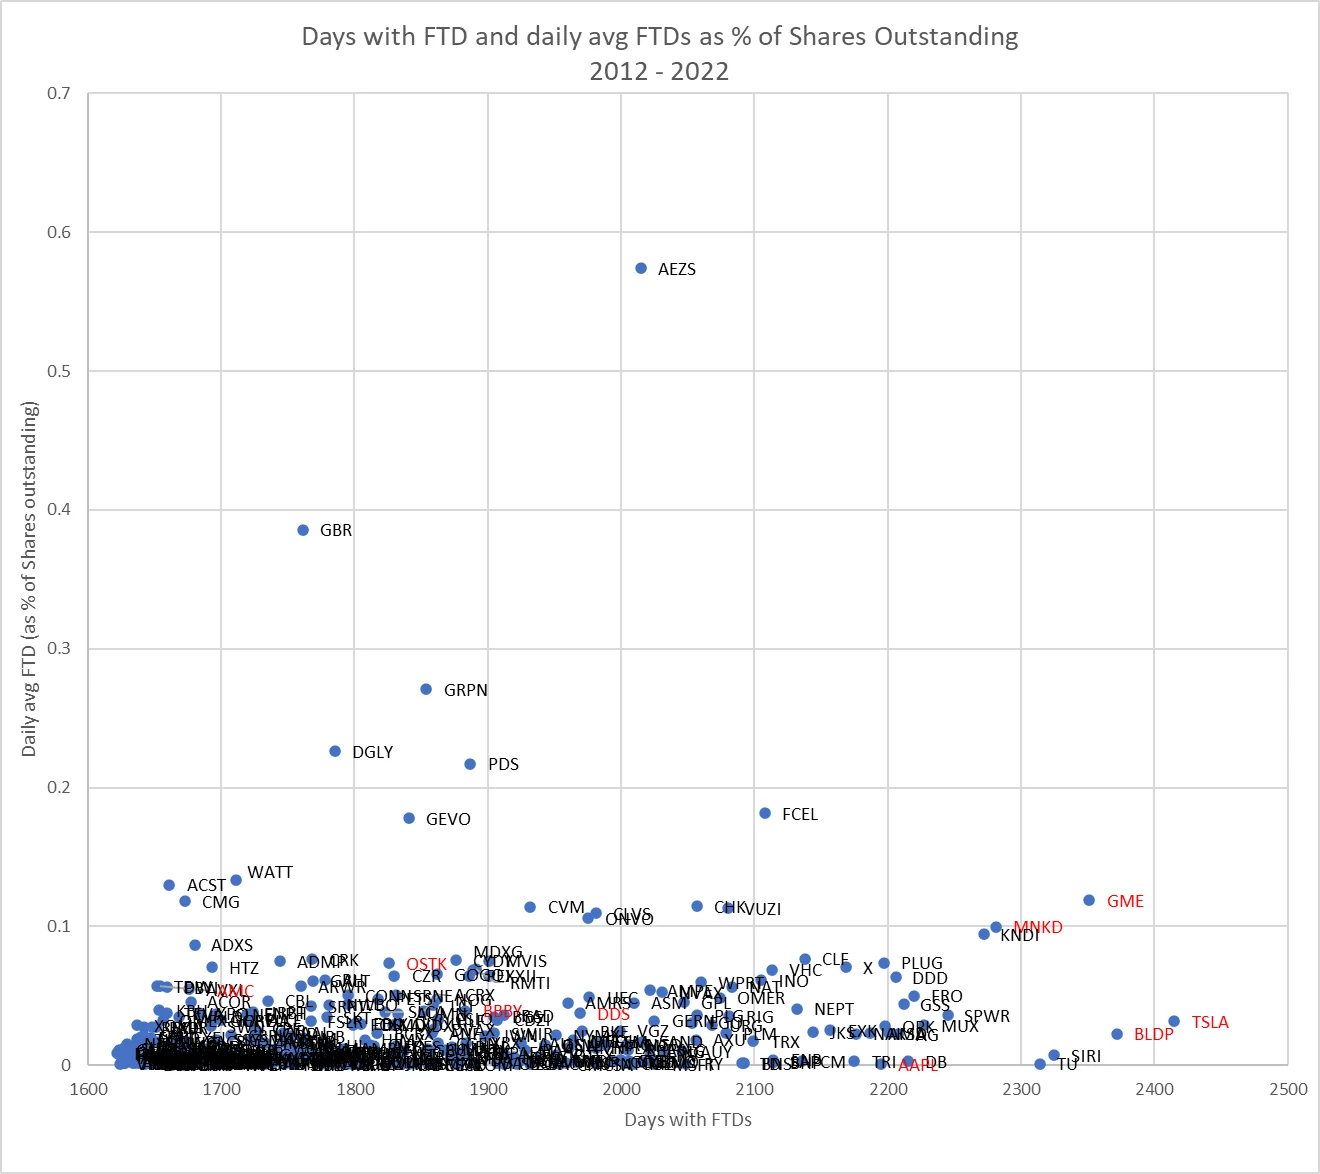
Days with FTD and daily avg FTDs as % of Shares Outstanding

Same as above but zoomed out
The work was inspired by u/sdfprwggv . Thanks! Even if I didn’t finish the work - maybe someone wants to continue.
Could also provide the source. Everything was written in Python.
Great work! What does 10 years mean, is it total volume over 10 years and average daily FTD in the same period? Did GME become an outlier during the sneeze or was it already 10 years ago?
Thank you. Yes total volume for 10y and avg daily FTD for the same period. A very good question! See:
Indeed GME was always on the top, but became the outlier during the sneeze in terms of volume. If I would redo the graph I think BBBY would have a similar position.