- cross-posted to:
- rust@lemmy.ml
- cross-posted to:
- rust@lemmy.ml
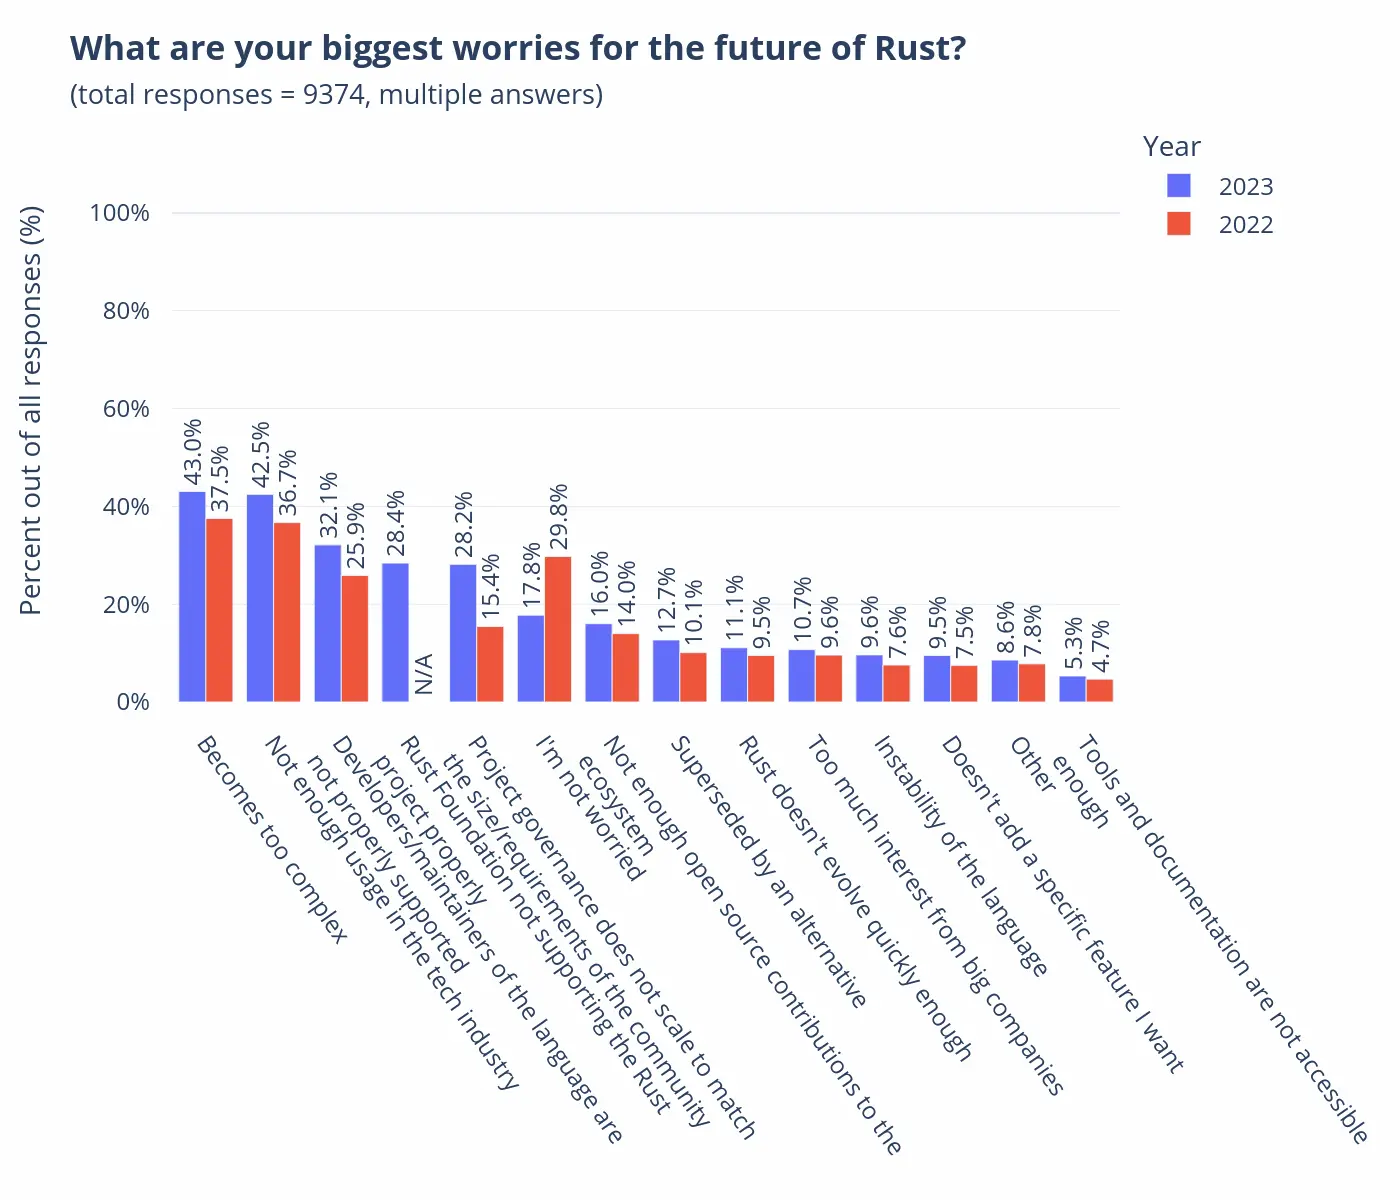
The “what are your biggest worries” graph is, ironically, a little worrying:

Significant increases in “Project governance does not scale to matchthe size/requirements of the community” and decreases to “I’m not worried”. Hopefully this is something that will improve over time as the Rust leadership gets better settled. There was a lot of turmoil with that last year but I think it’s hopefully better now.
I know the ideal is a 50/50 split, but I think it’s nothing short of miraculous that 26% of respondents identify as women.
EDIT: Apparently that wasn’t even close to true; I misread the paragraph where the women were mentioned.
Unfortunately you need to read the paragraph above - only the 14% who answered yes are included. So it’s 26% of those 14%, so it’s more like 3.6%…
However it’s worth noting that there could be women who did not answer yes to the marginalised group question so it’s probably more than that.
Ah, you’re right! I didn’t even realize “woman” was on the list of marginalized groups. Guess that says something about me… Thanks for clearing up the confusion!
Wow, that was not at all clear. I was shocked that 50% of respondants identify as LGBTQ; 7% is a much less surprising figure.


