Before I make this statement, yeah, I know where I am.
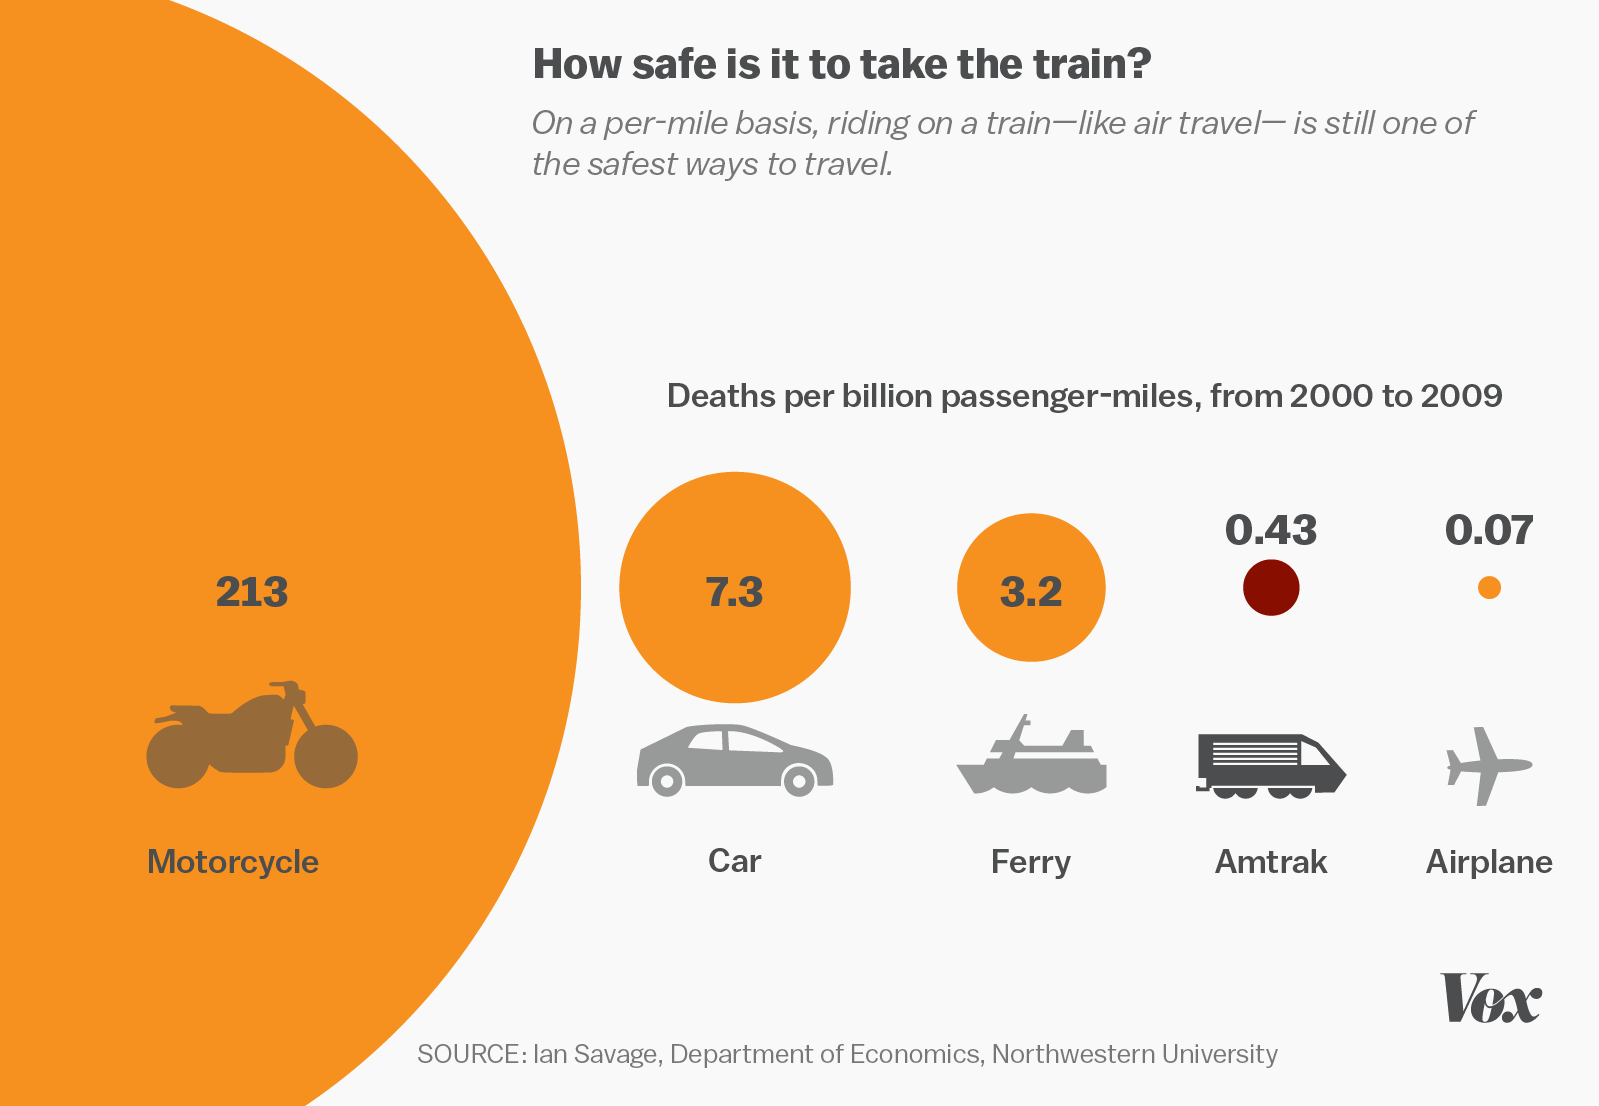
Deaths per billion passenger-miles
All of these fatality rates, for all of these forms of transportation, are vanishingly small. Comparing the rates of one vehicle to another with phrases like “17 times more likely” while ignoring the “billion passenger-miles” scale is misleading.
In order to present these in a more complete way, the odds of dying on each of these vehicles is:
That is per mile, which is usually not the distance humans limit themselves to in their lives. Assuming you travel a million miles in your life, you do have a 20% chance of dying if exclusively using a motorcycle, which I would consider relevant. The change from car to train already far less so.
Assuming 20,000 miles traveled per year, it would take 50 years to reach 1,000,000 miles. So let’s lay out the % odds of fatality over 50 years, at 20,000 miles per year, if using each of these means exclusively:
Motorcycle: 21.3%
Car: 7.3%
Ferry 3.2%
Amtrak: 0.43%
Airplane: 0.07%
You’re also getting at another important point: it is difficult for people to really comprehend very large or very small numbers. With that in mind, if we divide each of those percentages by 50, we should come up with the odds of dying in a given vehicle per year, again, given a 20,000 mile per year usage and exclusive use of one vehicle type:
Motorcycle: 0.426%
Car: 0.146%
Ferry: 0.064%
Amtrak: 0.0086%
Airplane: 0.0014%
Of these, only motorcycle and car are anywhere near significant, and they’re still really unlikely. The remaining three still are small enough to be essentially incomprehenisble. (And who travels 20,000 miles a year on a ferry, anyway?)
Another bit I would like to note is that the comparison posed was between car and train, based on safety. Why was airplane not mentioned? It’s far and away the least likely to kill you.
Of course airplane wasn’t mentioned. Airplanes are not appropriate solutions to many kinds of necessary travel, and airplanes in general have a worse reputation for their environmental effects. Trains are not solutions to many kinds of necessary travel, either, at least not in the current landscape of travel options available to very many people in the United States.
Again, I know exactly where I’m commenting. I definitely think that there should be way more public transportation options available. I think the number of individual-operated vehicle miles can and should be reduced. I think the kinds of individual-operated vehicles should be addressed more sensibly (we don’t get to have the small pickups of the 80s and 90s because of unintended consequences of CAFE standards driving manufacturers to create larger and larger “light” trucks, for example).
Pointing out that “cars are 17 times more likely to kill you than trains!” does not serve the purpose of making a better world through transportation reform.
Trains are not solutions to many kinds of necessary travel, either, at least not in the current landscape of travel options available to very many people in the United States.
That’s kind of the point though. Trying to get folks in the US to support better travel infrastructure. Doesn’t even always have to be trains.
Pointing out that “cars are 17 times more likely to kill you than trains!” does not serve the purpose of making a better world through transportation reform.
Why not? Everything you said honestly made it sound like everything else is a much safer alternative than personal vehicles. Why is that not an argument for better infrastructure and transportation reform? I’ve known people who have died in car accidents. I do not know anyone that’s even been in a train accident let alone killed in one. Your numbers are not that supportive of cars being generally safe. Those are not great odds when considering the loss is catastrophic. It’s probably one of the biggest risks folks willingly take and will actively avoid lesser risks.
Also not saying it’s wrong, but why are we dividing by 50? It’s per mile basis. If it’s 20000 miles per year, it’s already by year, no?
Also not saying it’s wrong, but why are we dividing by 50?
yes, 7% dead by 50 seems a lot to me. I see no reason to split that to an annual rate either.
50 is still young to die, so all of that 7% died young, when still of working age
If car is a fundamental long-term lifestyle choice/situation then people are exposed to the risk for a long period of time. ,20,30, 40 50 years. Its probbaly a decision on the same frquency as the choice to live urban/suburb/rural - maybe every 5-10 years to make a choice - but maybe a change only a few times in a lifetime.
Put this another way…
If the car users had decent range and network of bus /train /cycle /walk options and were willing to use them , they might be able to choose their risk exposure year by year, trip by trip and minimise it.
but without those alternatives in place, it’s just not a year-by-year decision for many people.
7% probably will die and may not feel they had the choice to do anything else.
I assume you’d see it as one of the leading causes of death (in the working age population) for that reason. Sorry i don’t know those stats of the top of my head- and i don’t know how to search on the internet.
The only thing i’d caveat with the stats are, safety figures from 2000-2009 will not be representative of 30-50 years from now.
Hopefully road design will improve - and vehicle design will definitely become safer for those in the cars. so the risk will likely fall.
Though the interaction between safety and congestion can go either way.
but suppose the risk halves (i’d reckon optimistic) the 7% drop to 3.5% i think that’s still a serious killer in my book.
if we divide each of those percentages by 50, we should come up with the odds of dying in a given vehicle per year,
I’m being very nitpicky but this isn’t quite how it works, if you have a 90% chance of survival one year, you’d have 0.9^2 = 0.81= 81% chance of surviving two years in a row. With that in mind, the odds of dying should be relative to the fiftieth root of surviving fifty years, which gives:
Motorcycle: 0.478%
Car: 0.151%
Ferry: 0.065%
Amtrak: 0.0086%
Airplane: 0.0014%
Without additional decimals it’s hard to see the change for the really small numbers but it doesn’t make much of a difference in reality.
I have no idea about the statistics about motorcycle fatalities and for personal reasons I’d prefer not to get into them. I was just commenting on the way the statistics were calculated year-by-year with the assumption that the original statistics for fifty years were accurate. That being said, it’s possible that those statistics were not completely correctly calculated as well.
The fifty year statistics were also computed wrong, for the same reason you already explained. It doesn’t make much of a difference since the probabilities are so small anyway.
1 in 1000 is not really unlikely if it is in regards to your life ending.
However even taking your number it would lead to devastating pictures.
2 married people with 4 grandparents 1 aunt 3 friends and 3 kids means every year 22±5 out of a small 1000 family neighbourhood will be affected by car deaths.
Assuming that a relevant time period is from the birth of a child till it is 30 and therefore might have had a child of their own, so 30 years we get that around 66%±10% of families will be affected. Instead of only 1-3 families during that time.
You did not lift the veil of ignorance, you created a new veil of diffusion.
It would mean that two out of three families would lose a close person within a 30 year generation due to cars, instead of only a small percentage. This is the power of the 17 times!
The alternative of train rides would mean that within a generation virtually no family is affected by car deaths.
There is quite a bit wrong with your comment. The odds don’t change whether you give them in km or billion kms. However “the odds of dying on each of these” is wrong: Those are not the odds.
As you wrote what you wrote it would mean that only 2 people in the whole US population of 300 million would die on a car.
(annualized) death rate was 1.66 per 10,000 vehicles
The 17times more likely is telling the truth. Of course you could do look at miles consumed per mode of transport, but the point will remain that trains are much more safer (and some people die on them rather by old age, than accidents).
In addition the way you present the numbers with leading zeroes means you have no academic experience in the field of data presentation. Which shows.
Your math is not correct on this. You have stated the rate of deaths per mile, not the probability of not dying per mile, e.g. if 2 people died per mile, then the probability of dying per mile is not 200%.
I believe this should follow a Poisson distribution, i.e.f(k;m) = ((rm)^k * e^-(rm)) / k!, where k is the number of deaths, m is the miles traveled, and r is the deaths per mile. Then, the probability of dying after traveling m miles is 1 - f(0;m), i.e. the probability of no deaths occurring. Thus, the probability of dying when traveling 10^6 miles is 1 - e^-(7.3 / 10^9 * 10^6) = 0.727%.

Before I make this statement, yeah, I know where I am.
All of these fatality rates, for all of these forms of transportation, are vanishingly small. Comparing the rates of one vehicle to another with phrases like “17 times more likely” while ignoring the “billion passenger-miles” scale is misleading.
In order to present these in a more complete way, the odds of dying on each of these vehicles is:
That is per mile, which is usually not the distance humans limit themselves to in their lives. Assuming you travel a million miles in your life, you do have a 20% chance of dying if exclusively using a motorcycle, which I would consider relevant. The change from car to train already far less so.
Fair and excellent points.
Assuming 20,000 miles traveled per year, it would take 50 years to reach 1,000,000 miles. So let’s lay out the % odds of fatality over 50 years, at 20,000 miles per year, if using each of these means exclusively:
You’re also getting at another important point: it is difficult for people to really comprehend very large or very small numbers. With that in mind, if we divide each of those percentages by 50, we should come up with the odds of dying in a given vehicle per year, again, given a 20,000 mile per year usage and exclusive use of one vehicle type:
Of these, only motorcycle and car are anywhere near significant, and they’re still really unlikely. The remaining three still are small enough to be essentially incomprehenisble. (And who travels 20,000 miles a year on a ferry, anyway?)
Another bit I would like to note is that the comparison posed was between car and train, based on safety. Why was airplane not mentioned? It’s far and away the least likely to kill you.
Of course airplane wasn’t mentioned. Airplanes are not appropriate solutions to many kinds of necessary travel, and airplanes in general have a worse reputation for their environmental effects. Trains are not solutions to many kinds of necessary travel, either, at least not in the current landscape of travel options available to very many people in the United States.
Again, I know exactly where I’m commenting. I definitely think that there should be way more public transportation options available. I think the number of individual-operated vehicle miles can and should be reduced. I think the kinds of individual-operated vehicles should be addressed more sensibly (we don’t get to have the small pickups of the 80s and 90s because of unintended consequences of CAFE standards driving manufacturers to create larger and larger “light” trucks, for example).
Pointing out that “cars are 17 times more likely to kill you than trains!” does not serve the purpose of making a better world through transportation reform.
That’s kind of the point though. Trying to get folks in the US to support better travel infrastructure. Doesn’t even always have to be trains.
Why not? Everything you said honestly made it sound like everything else is a much safer alternative than personal vehicles. Why is that not an argument for better infrastructure and transportation reform? I’ve known people who have died in car accidents. I do not know anyone that’s even been in a train accident let alone killed in one. Your numbers are not that supportive of cars being generally safe. Those are not great odds when considering the loss is catastrophic. It’s probably one of the biggest risks folks willingly take and will actively avoid lesser risks.
Also not saying it’s wrong, but why are we dividing by 50? It’s per mile basis. If it’s 20000 miles per year, it’s already by year, no?
yes, 7% dead by 50 seems a lot to me. I see no reason to split that to an annual rate either.
50 is still young to die, so all of that 7% died young, when still of working age
If car is a fundamental long-term lifestyle choice/situation then people are exposed to the risk for a long period of time. ,20,30, 40 50 years. Its probbaly a decision on the same frquency as the choice to live urban/suburb/rural - maybe every 5-10 years to make a choice - but maybe a change only a few times in a lifetime.
Put this another way…
If the car users had decent range and network of bus /train /cycle /walk options and were willing to use them , they might be able to choose their risk exposure year by year, trip by trip and minimise it.
but without those alternatives in place, it’s just not a year-by-year decision for many people.
7% probably will die and may not feel they had the choice to do anything else.
I assume you’d see it as one of the leading causes of death (in the working age population) for that reason. Sorry i don’t know those stats of the top of my head- and i don’t know how to search on the internet.
The only thing i’d caveat with the stats are, safety figures from 2000-2009 will not be representative of 30-50 years from now.
Hopefully road design will improve - and vehicle design will definitely become safer for those in the cars. so the risk will likely fall.
Though the interaction between safety and congestion can go either way.
but suppose the risk halves (i’d reckon optimistic) the 7% drop to 3.5% i think that’s still a serious killer in my book.
I’m being very nitpicky but this isn’t quite how it works, if you have a 90% chance of survival one year, you’d have 0.9^2 = 0.81= 81% chance of surviving two years in a row. With that in mind, the odds of dying should be relative to the fiftieth root of surviving fifty years, which gives:
Without additional decimals it’s hard to see the change for the really small numbers but it doesn’t make much of a difference in reality.
Thank you, 1/5 of lifetime motorcyclists dying in wreck doesn’t add up.
I have no idea about the statistics about motorcycle fatalities and for personal reasons I’d prefer not to get into them. I was just commenting on the way the statistics were calculated year-by-year with the assumption that the original statistics for fifty years were accurate. That being said, it’s possible that those statistics were not completely correctly calculated as well.
The fifty year statistics were also computed wrong, for the same reason you already explained. It doesn’t make much of a difference since the probabilities are so small anyway.
1 in 1000 is not really unlikely if it is in regards to your life ending.
However even taking your number it would lead to devastating pictures.
2 married people with 4 grandparents 1 aunt 3 friends and 3 kids means every year 22±5 out of a small 1000 family neighbourhood will be affected by car deaths.
Assuming that a relevant time period is from the birth of a child till it is 30 and therefore might have had a child of their own, so 30 years we get that around 66%±10% of families will be affected. Instead of only 1-3 families during that time.
You did not lift the veil of ignorance, you created a new veil of diffusion.
It would mean that two out of three families would lose a close person within a 30 year generation due to cars, instead of only a small percentage. This is the power of the 17 times!
The alternative of train rides would mean that within a generation virtually no family is affected by car deaths.
There is quite a bit wrong with your comment. The odds don’t change whether you give them in km or billion kms. However “the odds of dying on each of these” is wrong: Those are not the odds.
As you wrote what you wrote it would mean that only 2 people in the whole US population of 300 million would die on a car.
The 17times more likely is telling the truth. Of course you could do look at miles consumed per mode of transport, but the point will remain that trains are much more safer (and some people die on them rather by old age, than accidents).
In addition the way you present the numbers with leading zeroes means you have no academic experience in the field of data presentation. Which shows.
But where i live i need a car to travel to the train…
And the train doesnt go where i need to go.
i think this community sees that as one of the negative consequences of a high car dependent place.
Precisely the issue of car dependent infrastructure
Your math is not correct on this. You have stated the rate of deaths per mile, not the probability of not dying per mile, e.g. if 2 people died per mile, then the probability of dying per mile is not 200%.
I believe this should follow a Poisson distribution, i.e.f(k;m) = ((rm)^k * e^-(rm)) / k!, where k is the number of deaths, m is the miles traveled, and r is the deaths per mile. Then, the probability of dying after traveling m miles is 1 - f(0;m), i.e. the probability of no deaths occurring. Thus, the probability of dying when traveling 10^6 miles is 1 - e^-(7.3 / 10^9 * 10^6) = 0.727%.