

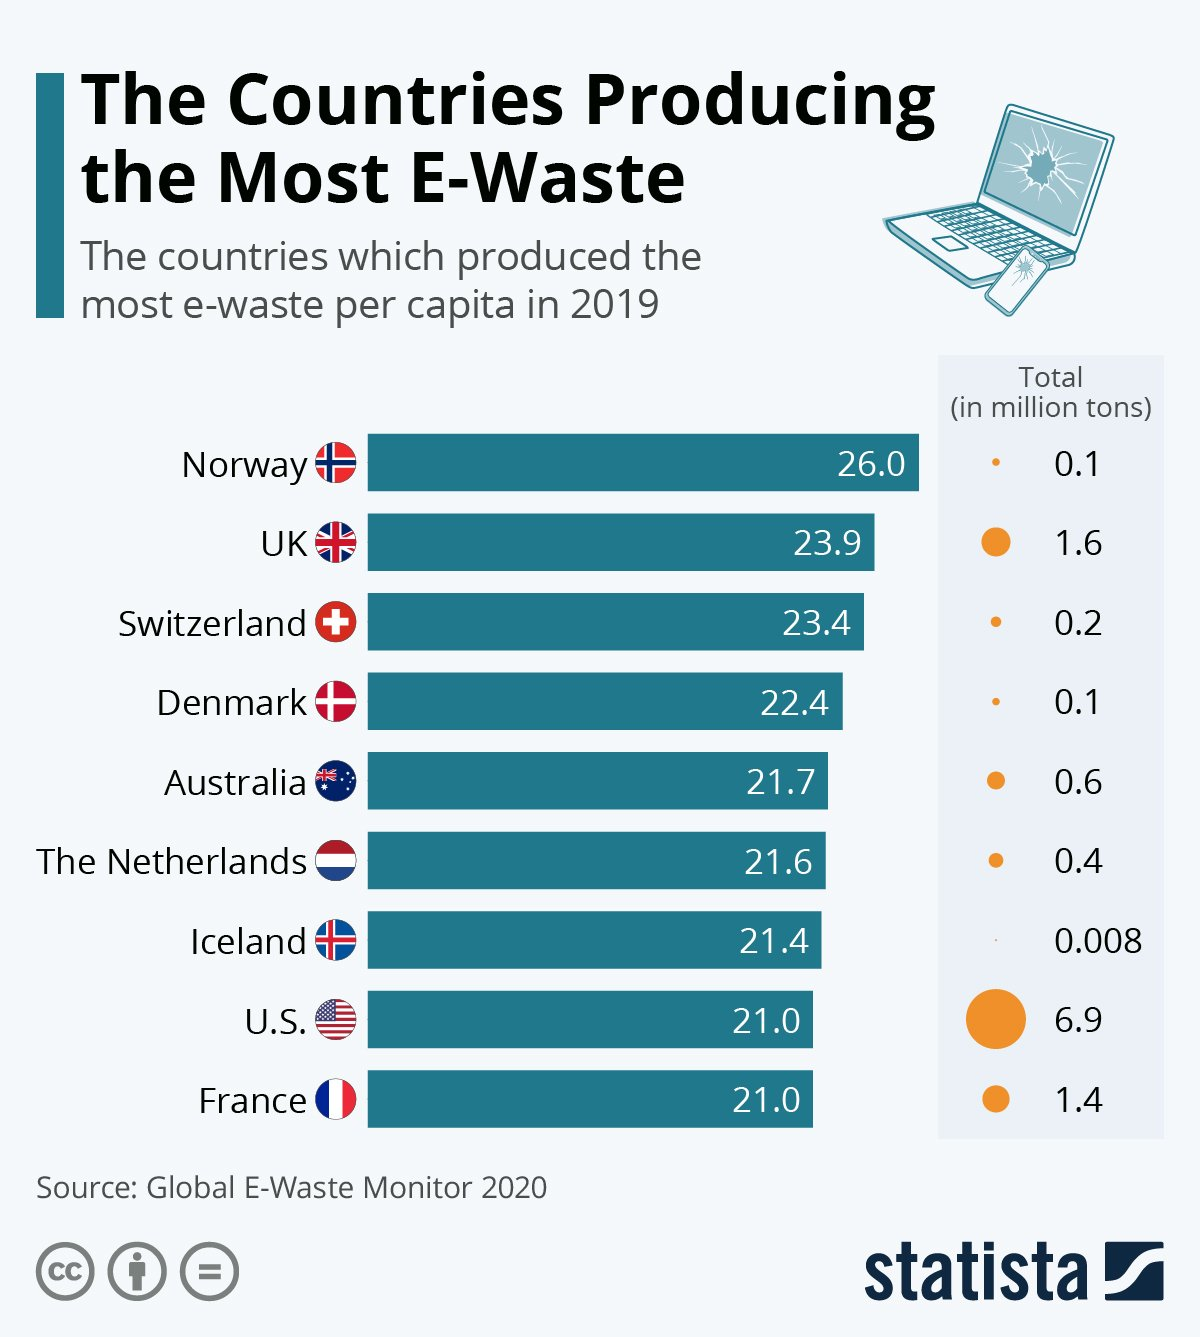
What is the graph unit?
I think it’s kg/capita
For the US:
(6.9×1000000×1000)÷(32.82×10000000) = ~21U.S. e-waste / U.S population = 0.0210 tonnes = 21.0 kg So I guess kg/person
What’s e-waste?
E-waste are electronics that are thrown out
Electronic waste, so things like computers, phones, tablets, etc.
this isn’t a terribly helpful graph as it is now, because it’s impossible to tell how much of this comes from different things like hand-help electronics like phones and laptops, home appliances and most importantly electric cars, being the most popular in nordic countries, which could count as a lot of e-waste…
Why shouldn’t those things be included exactly?
i’m not saying these should be excluded, but rather that the graph should somehow indicate these things
for example, a person
Xin some country might be buying a 100 gram smarphone every year for ten years and change three gasoline cars in that period, which would result in a kilogram of e-waste, whereas a personYin some different country could be using a single smartphone for this entire period and a single electric car in that period, which would result in a 2001 kilogram of e-wastethis creates a false impression that a person
Xis less wasteful, i.e. this graph should be adjusted for the sources of e-waste


